An Odometer Gauge
Learn how to create an odometer gauge using DataPicta.
This tutorial will guide you through the process of creating an odometer. Trust me, it will be incredibly simple.
Go to app.datapicta.com to open the DataPicta application.
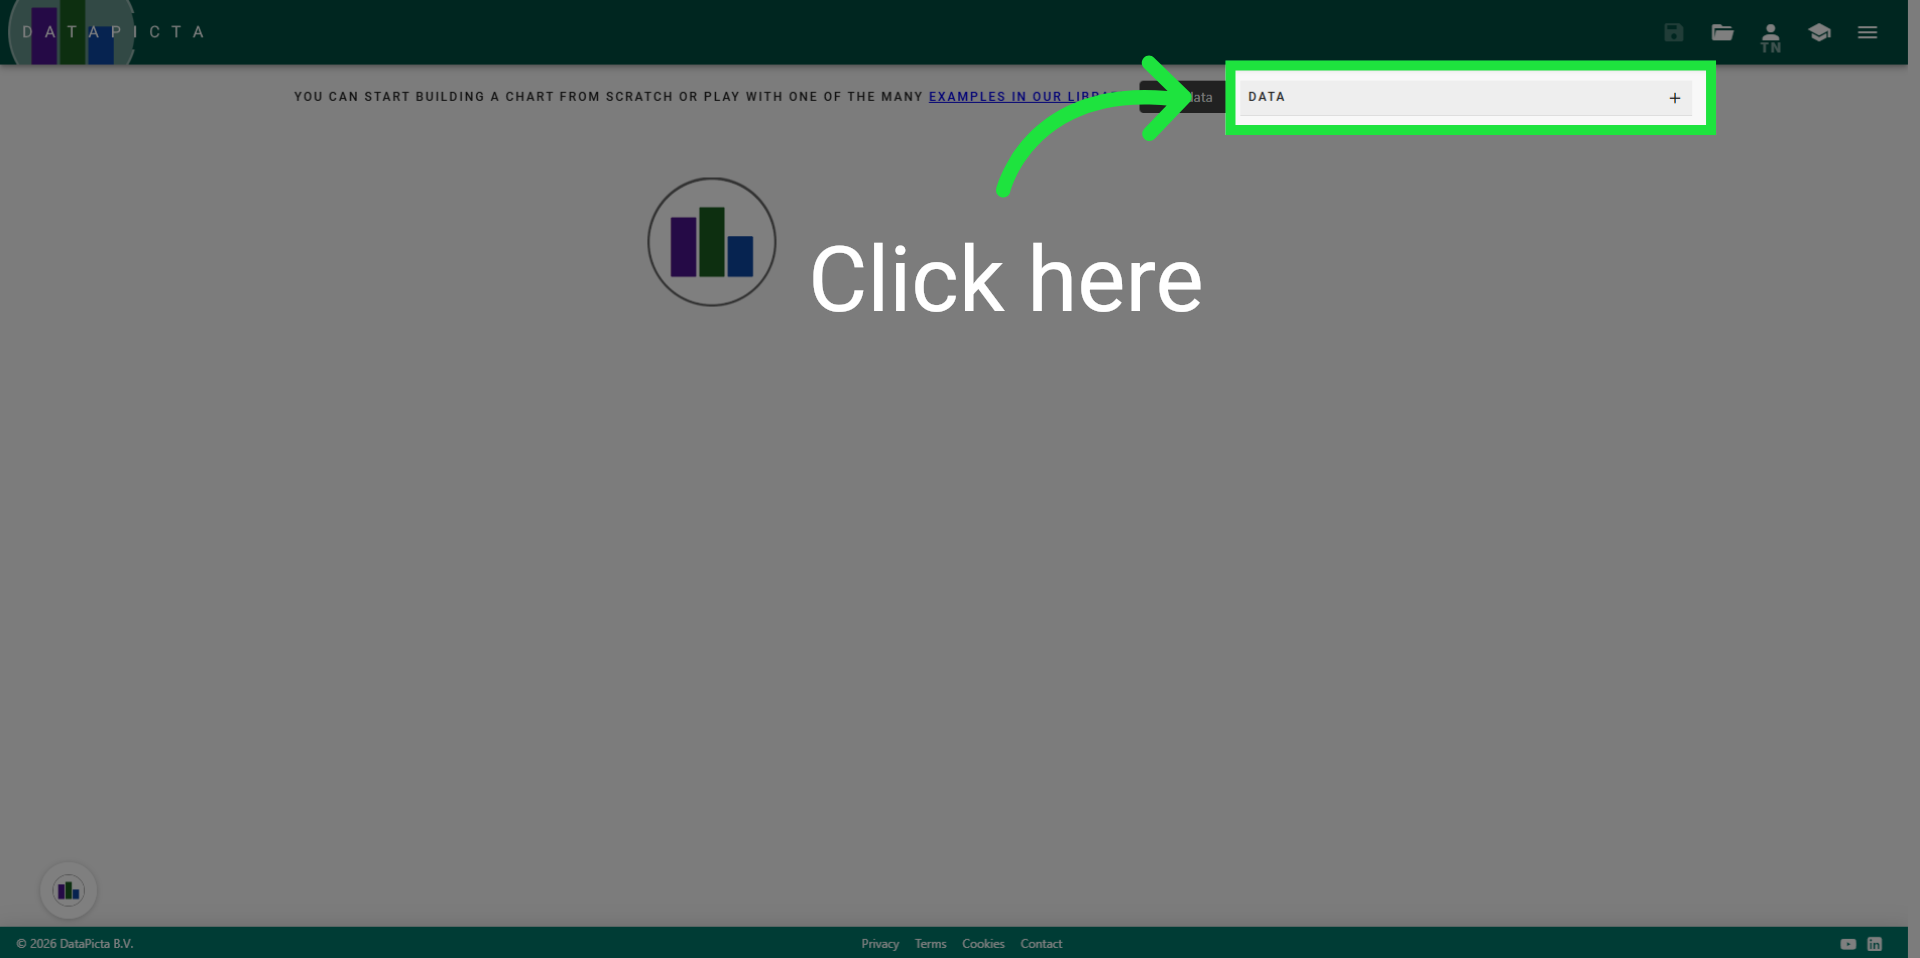
1. Add data
It starts by adding data. Click here.
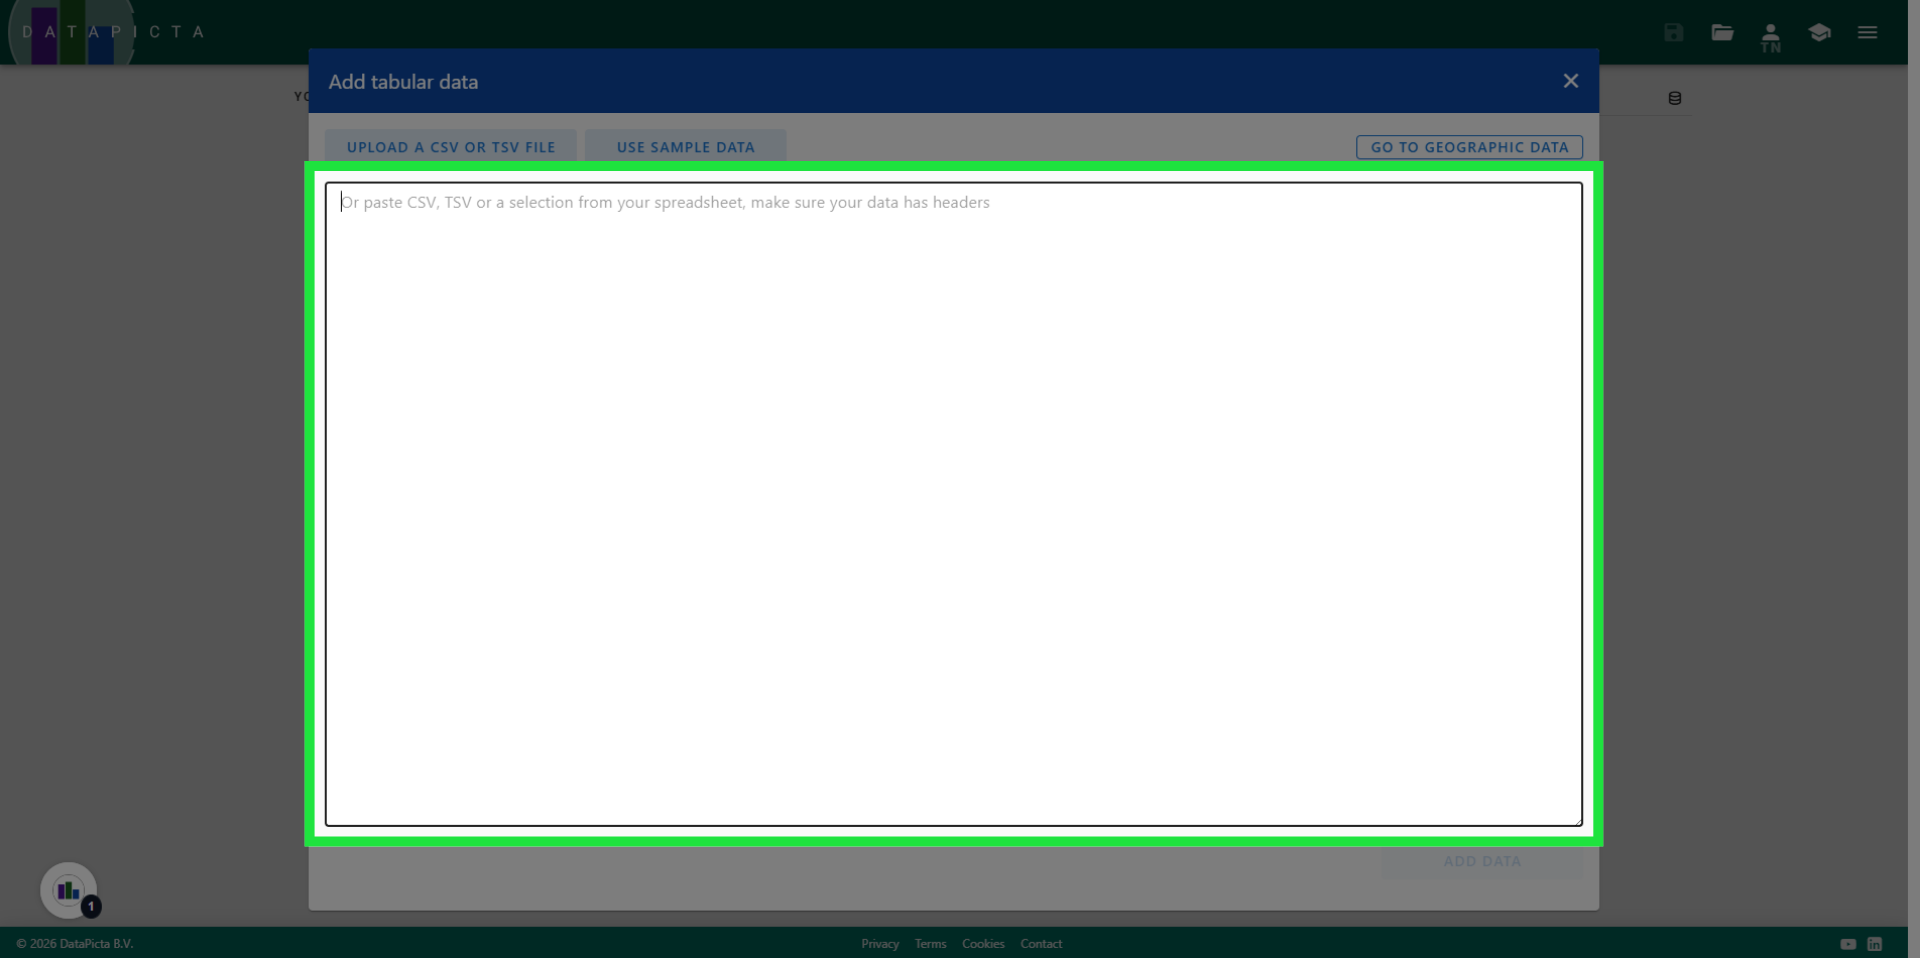
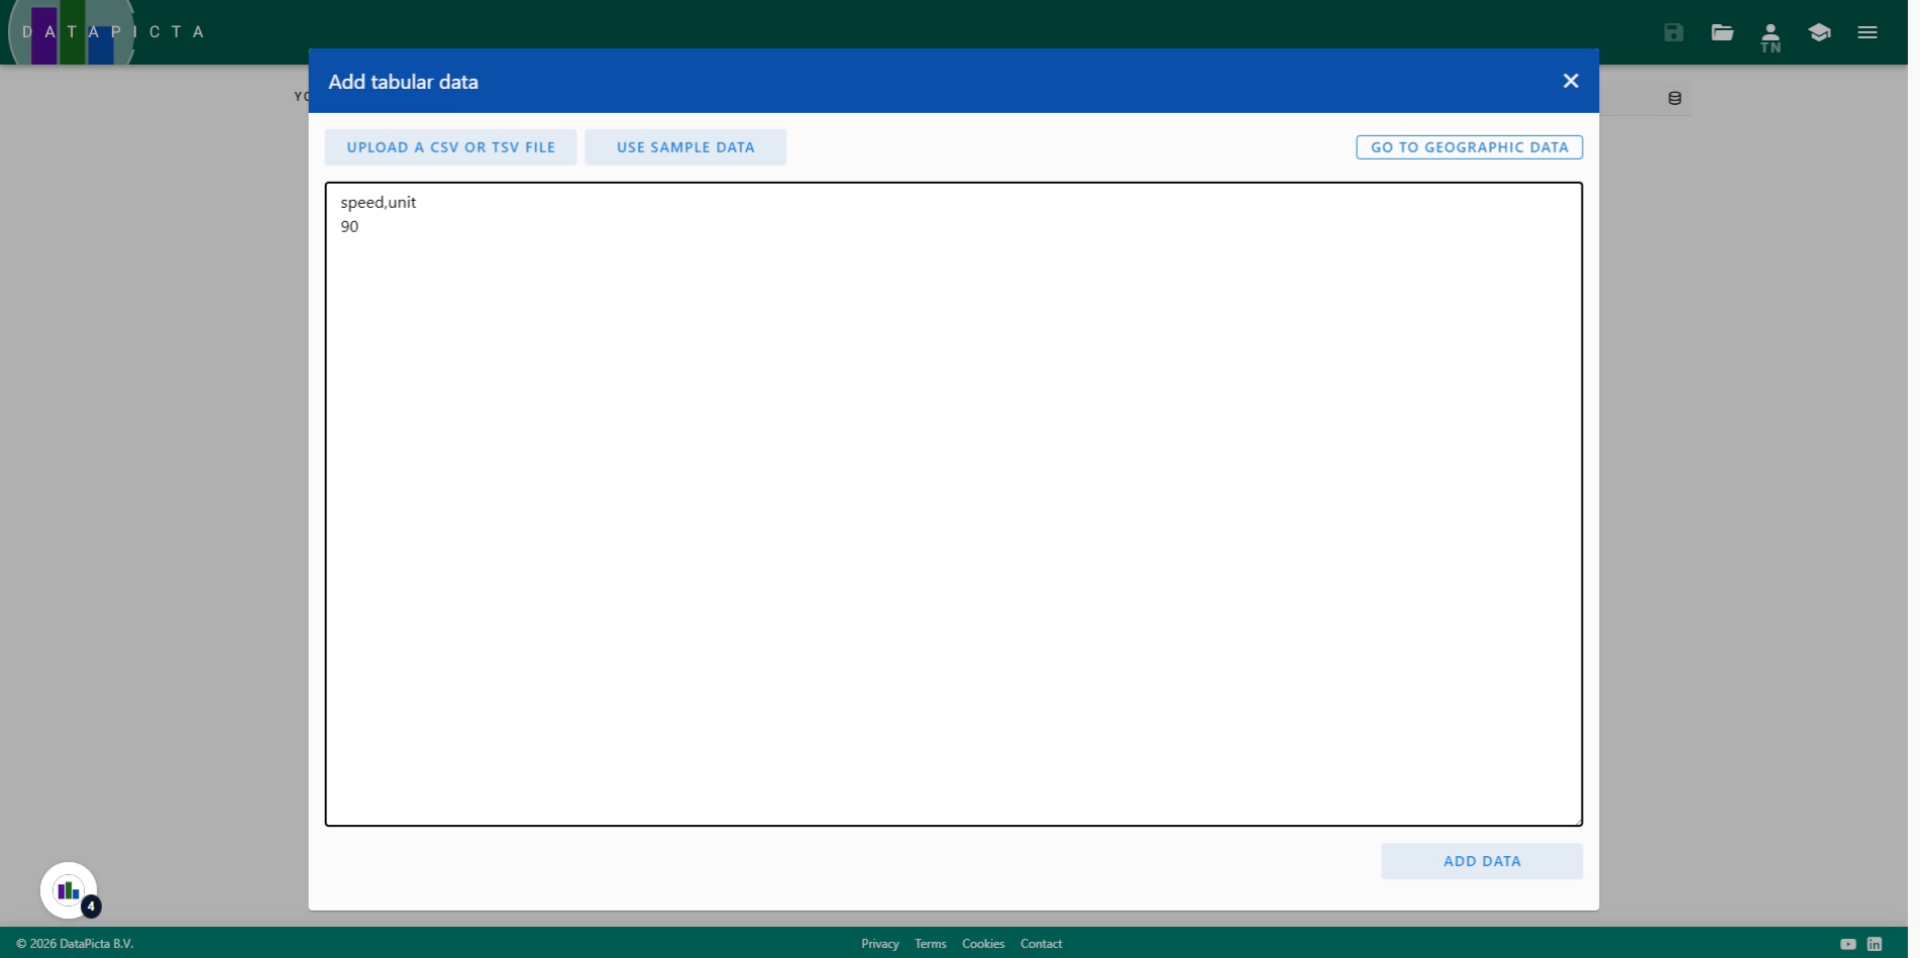
2. Type the Data
Since an odometer only displays one value we will type the data manually. Instead of opening a file.
3. Input field names
Type 'speed', followed by a comma and then type 'unit'. Press enter to go from defining the field names to the actual data.
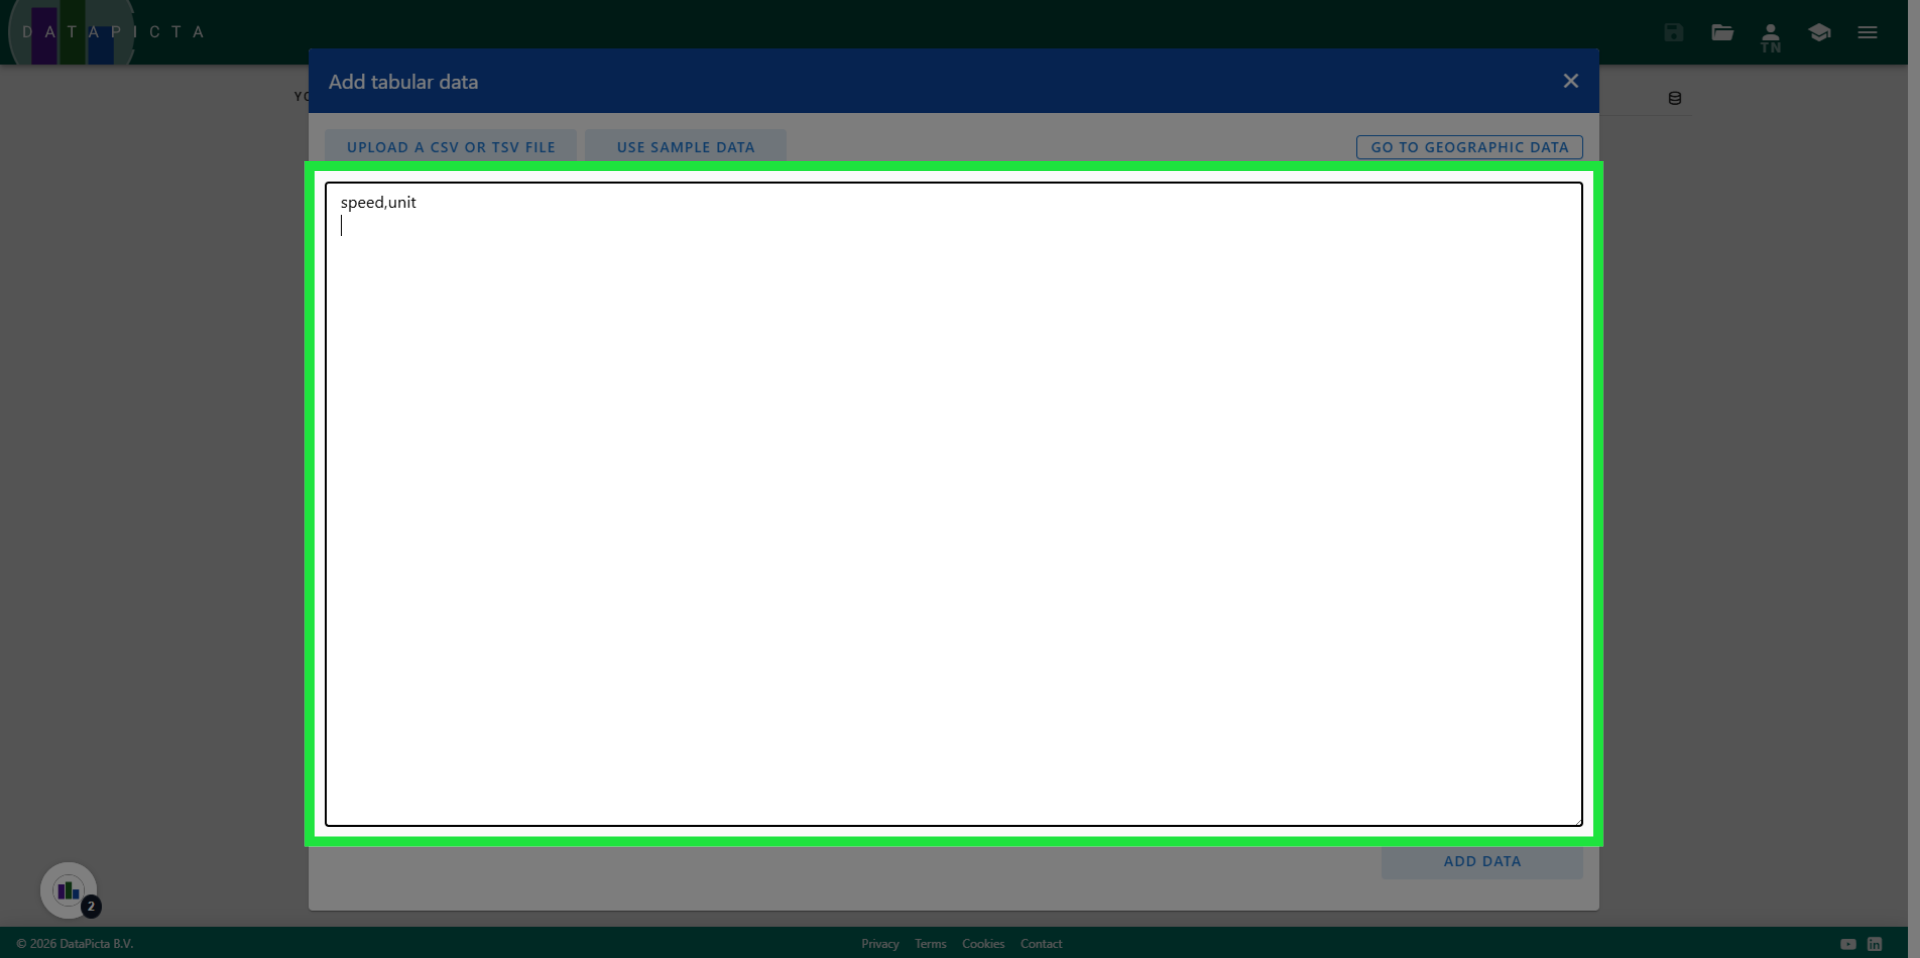
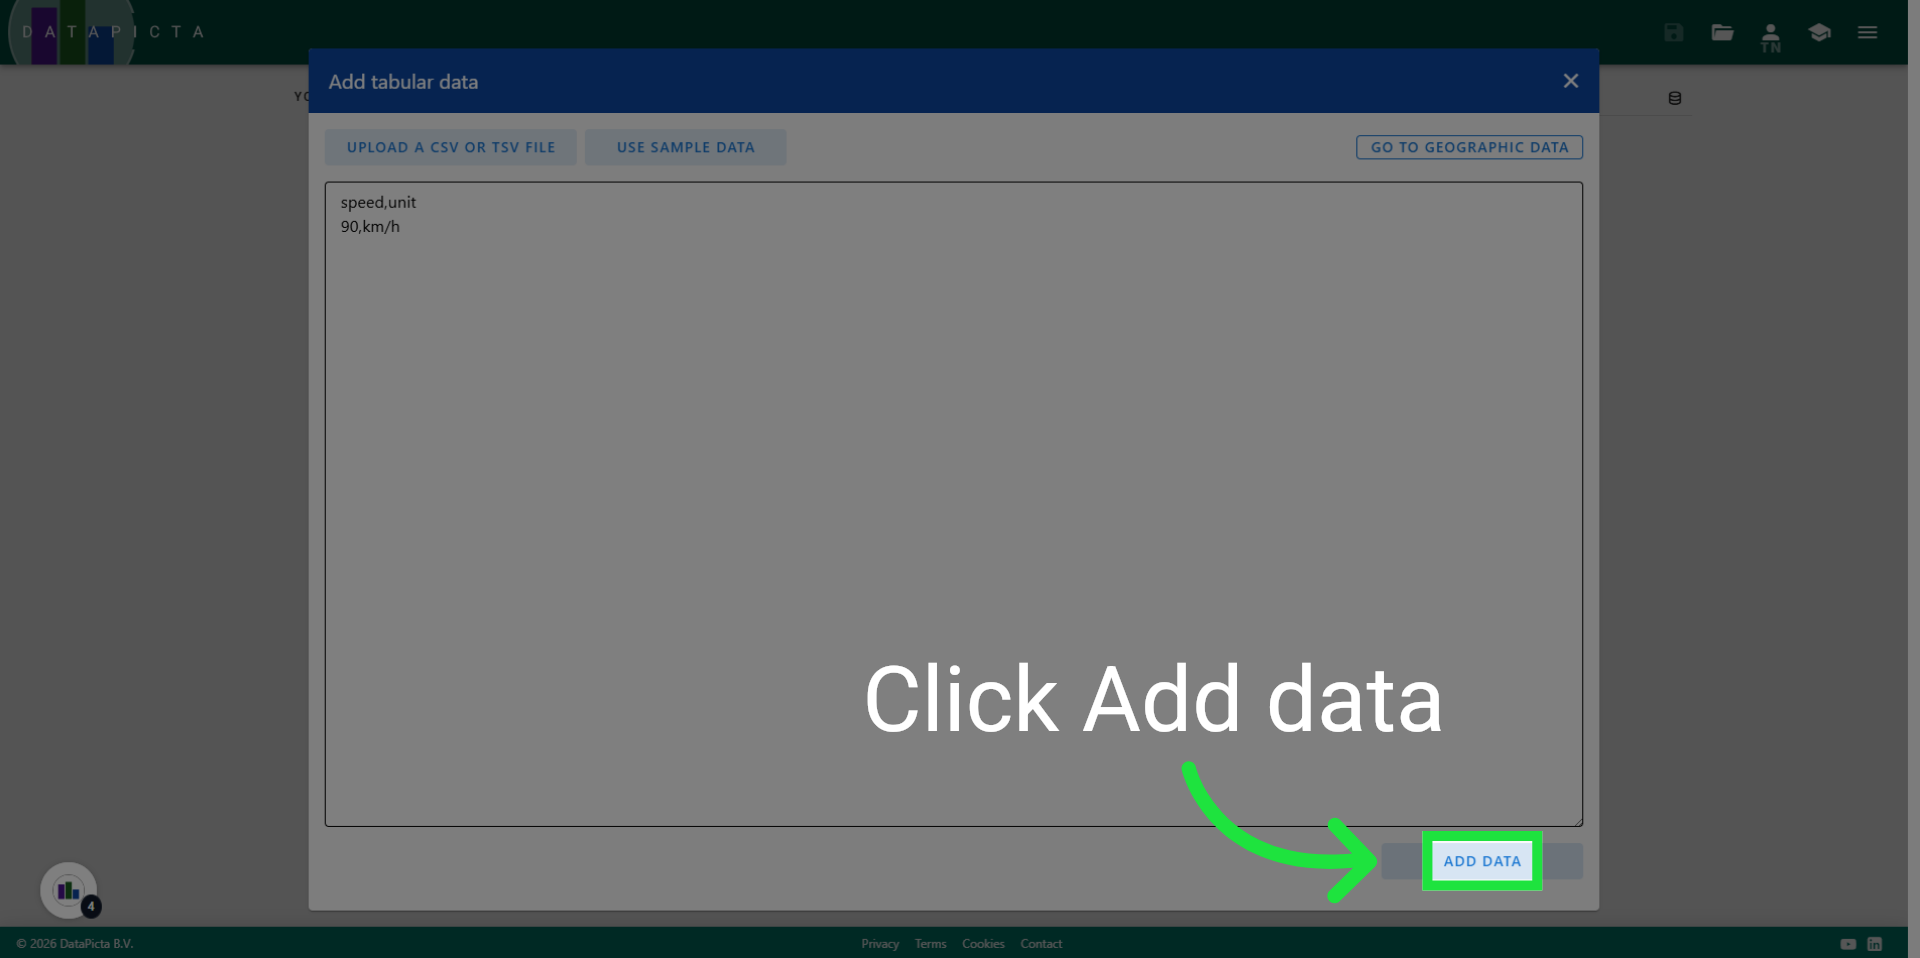
4. Input Data Values
Enter "90", comma, "km/h" to populate your dataset. You have just entered a dataset that conforms to the comma-separated value syntax, meaning the columns are separated by commas.
5. Add Data
Click "Add data" to include your data in the project.
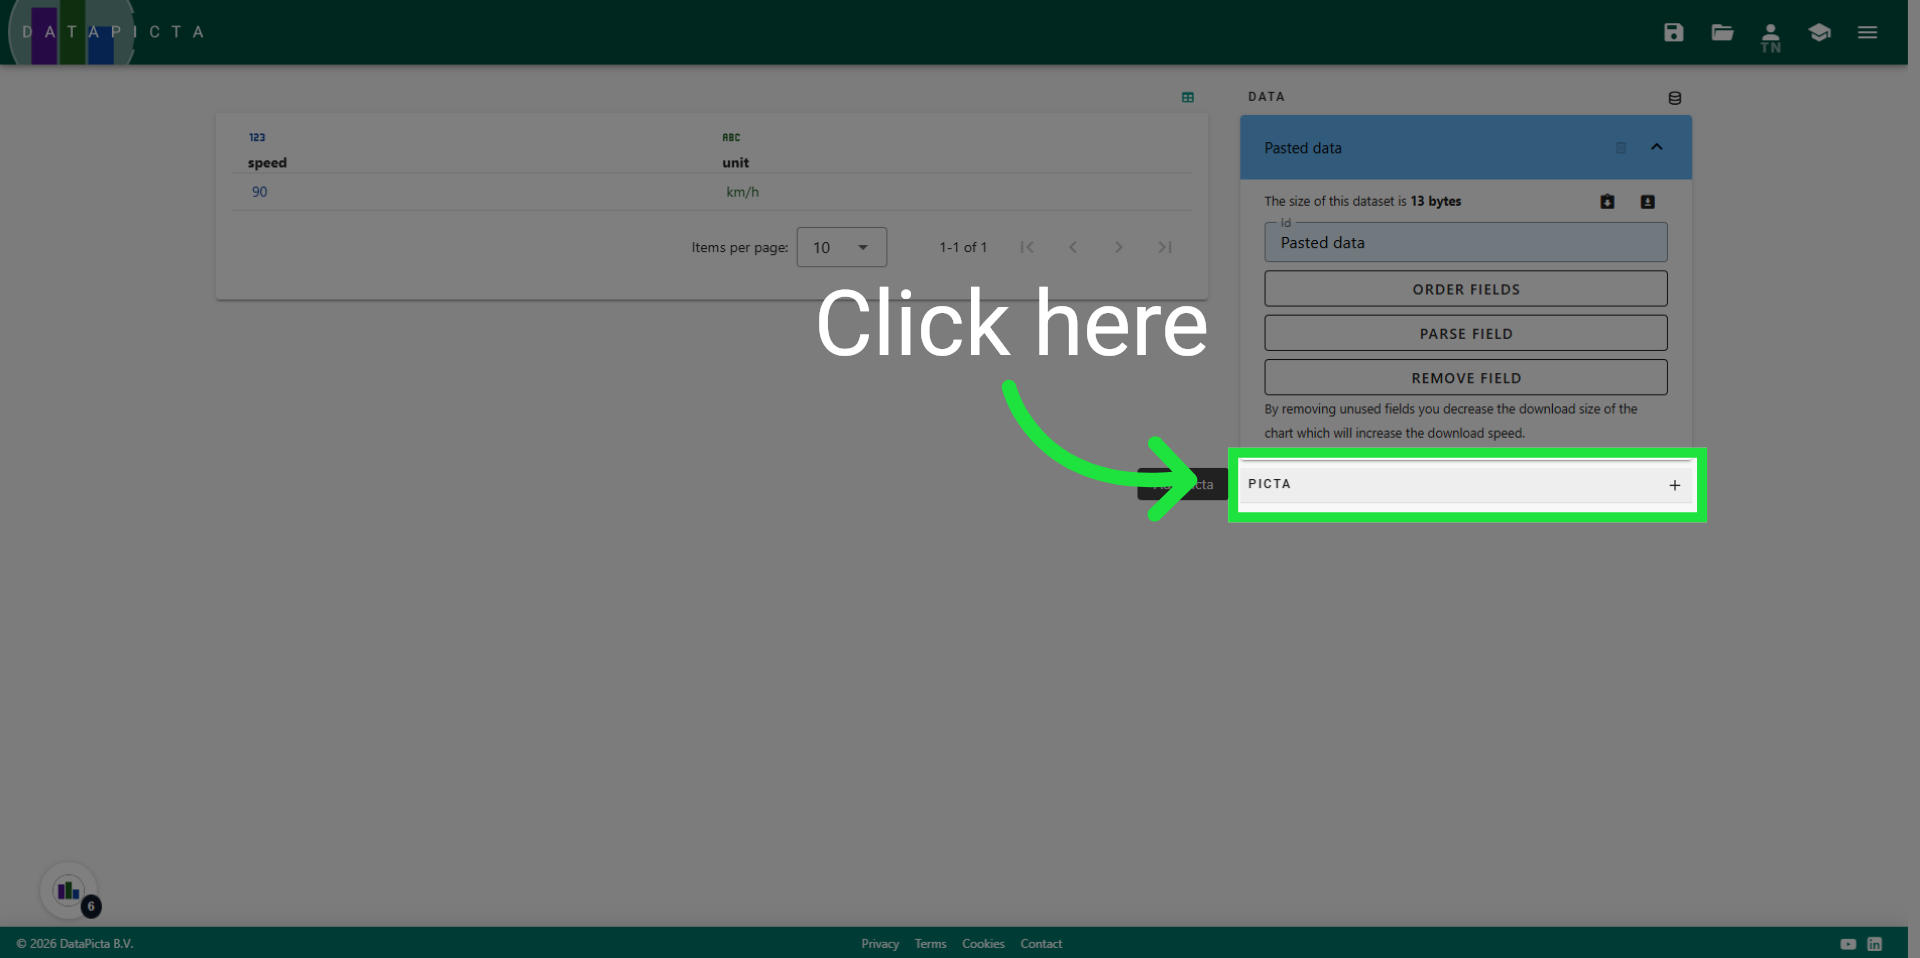
6. Open the Picta Dialog
Click here to open the picta dialog.
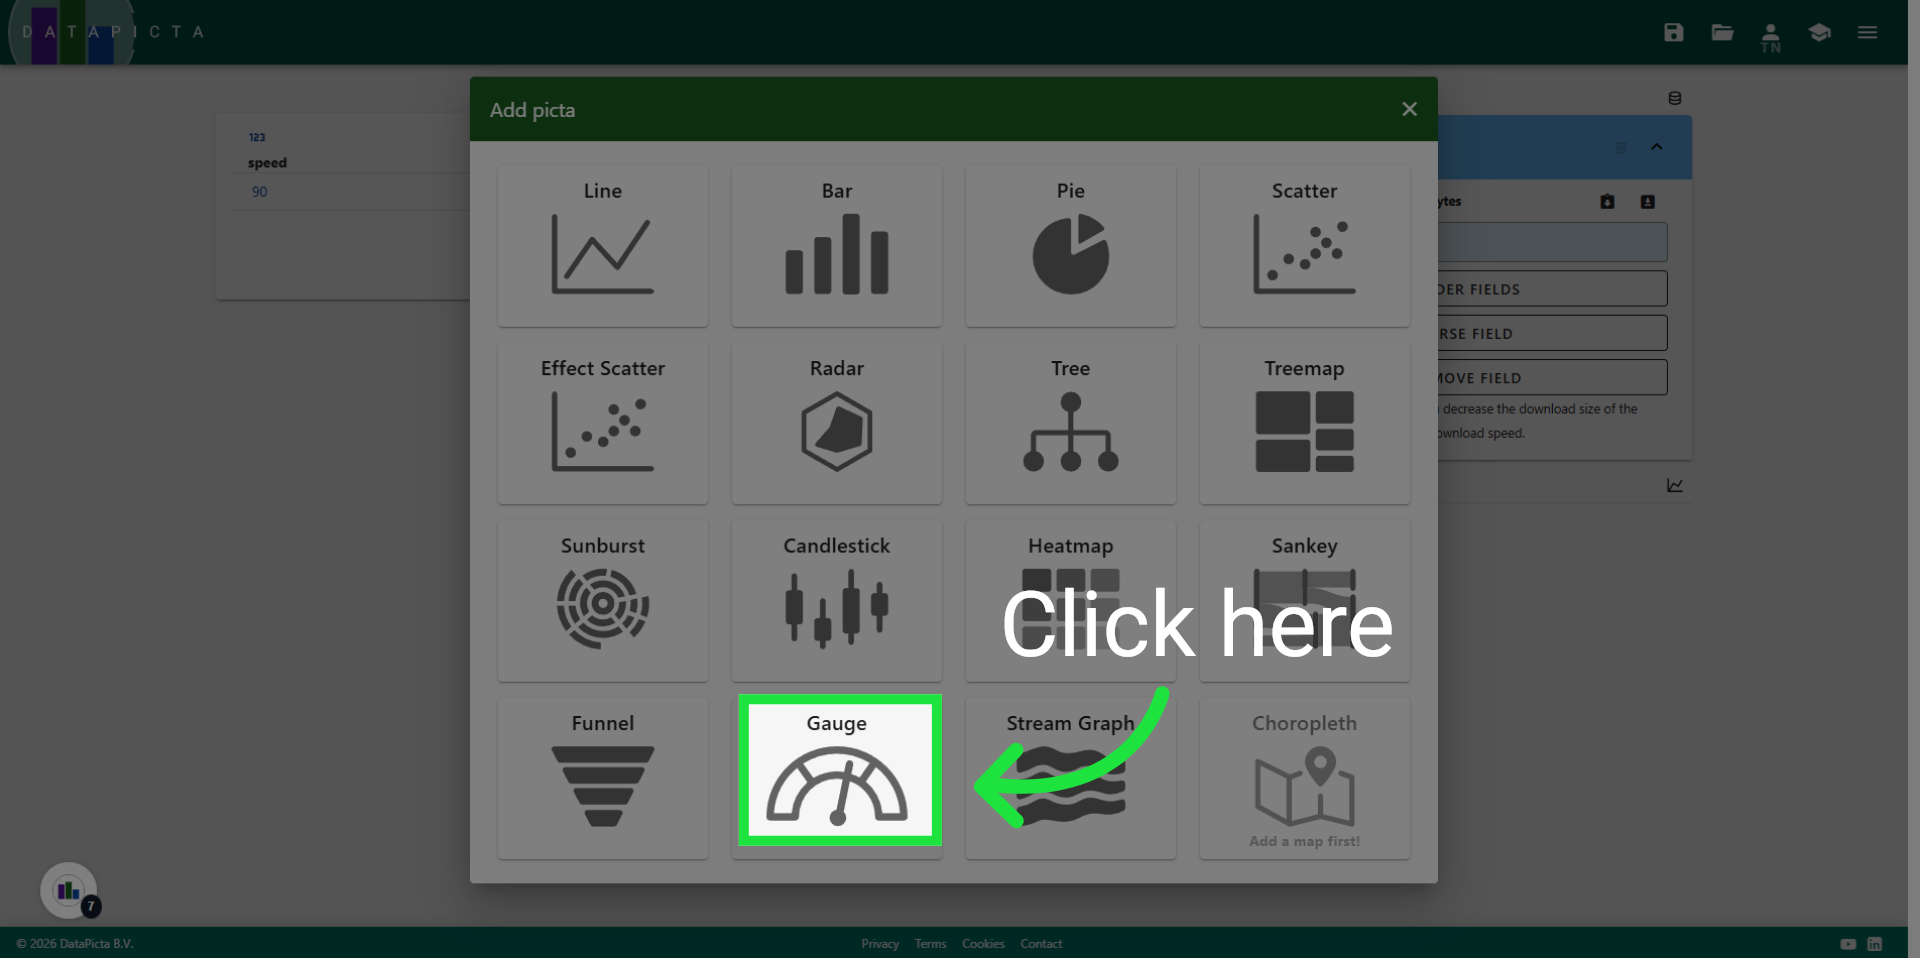
7. Select Gauge
Select the Gauge Picta.
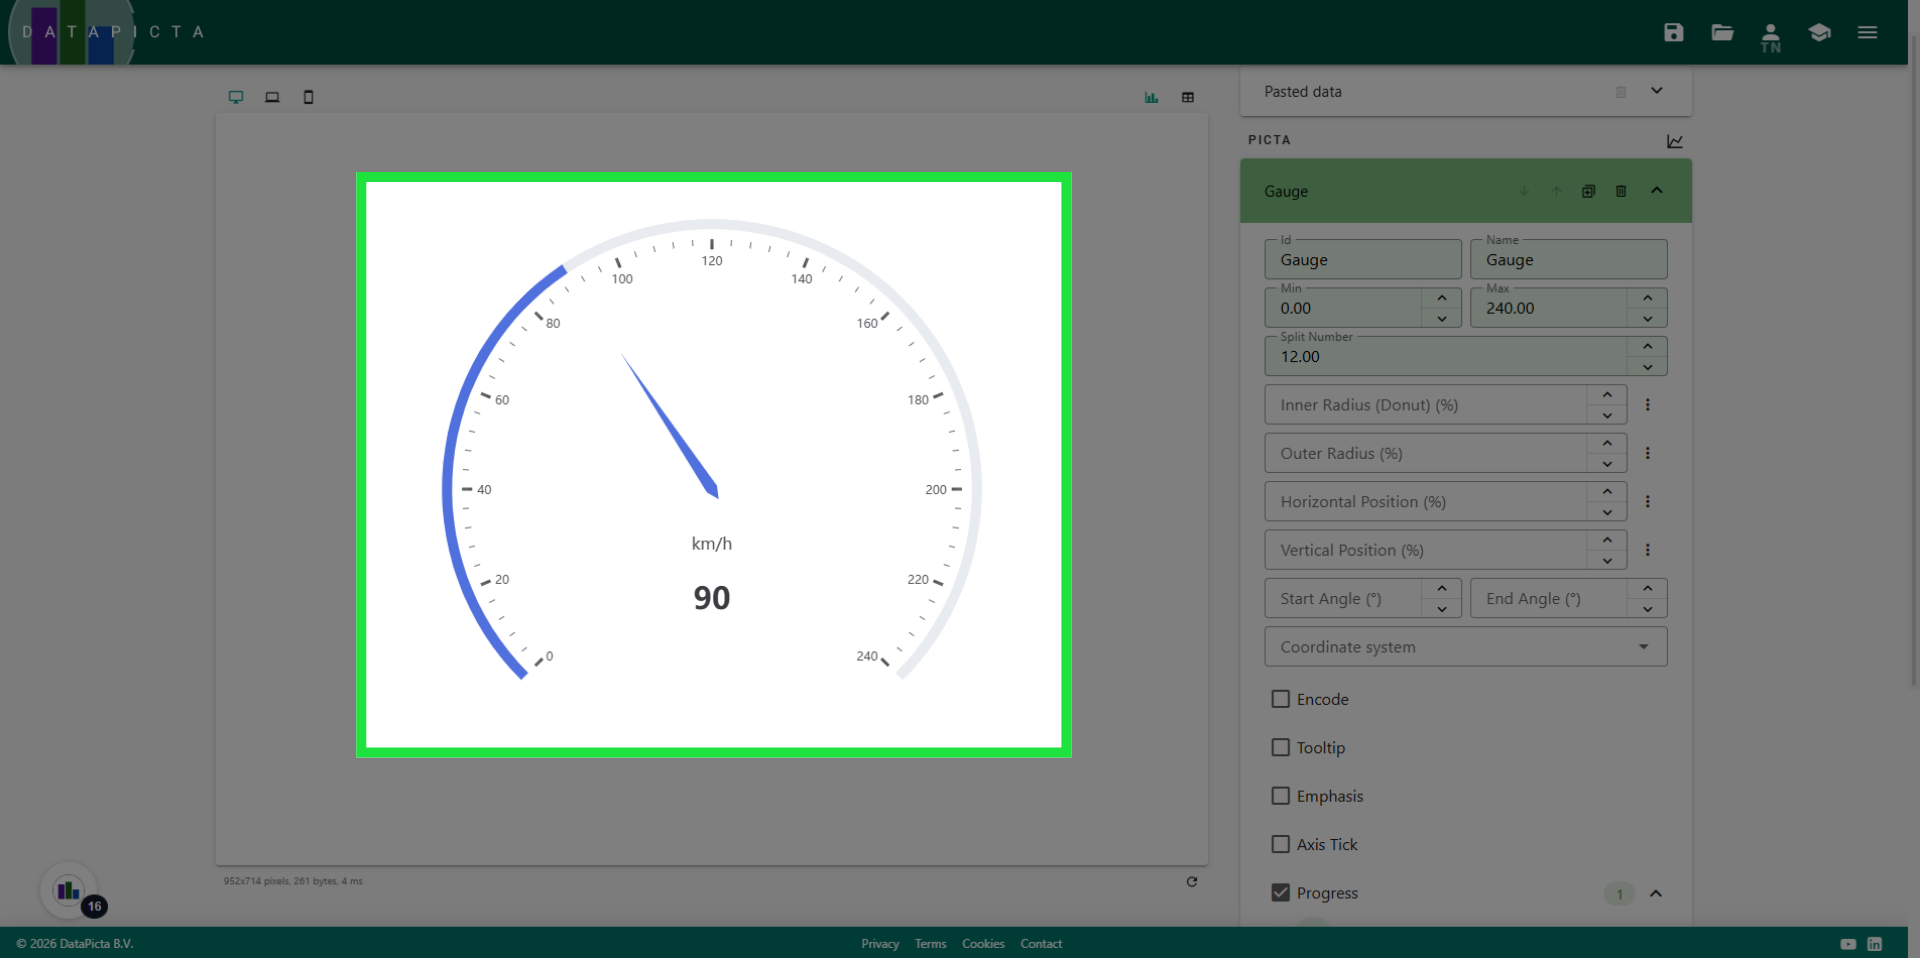
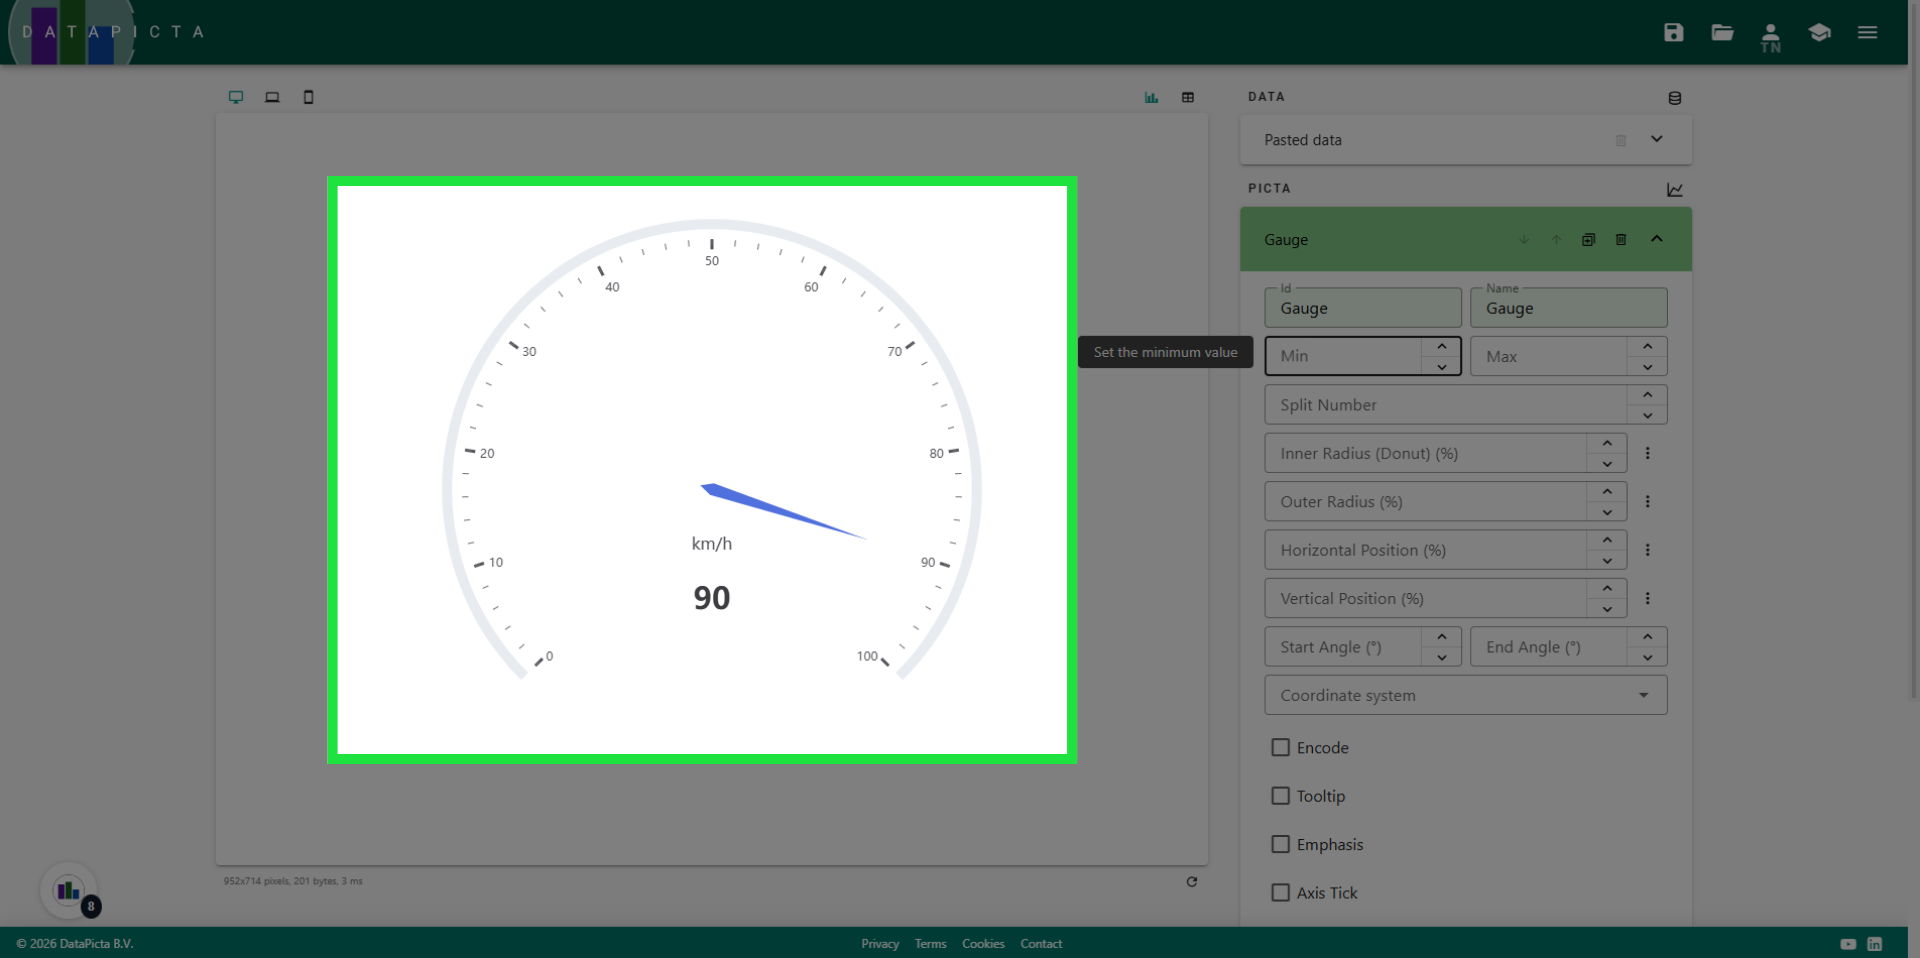
8. View result
The gauge is loaded; however, to convert it into an odometer, we need to adjust the range.
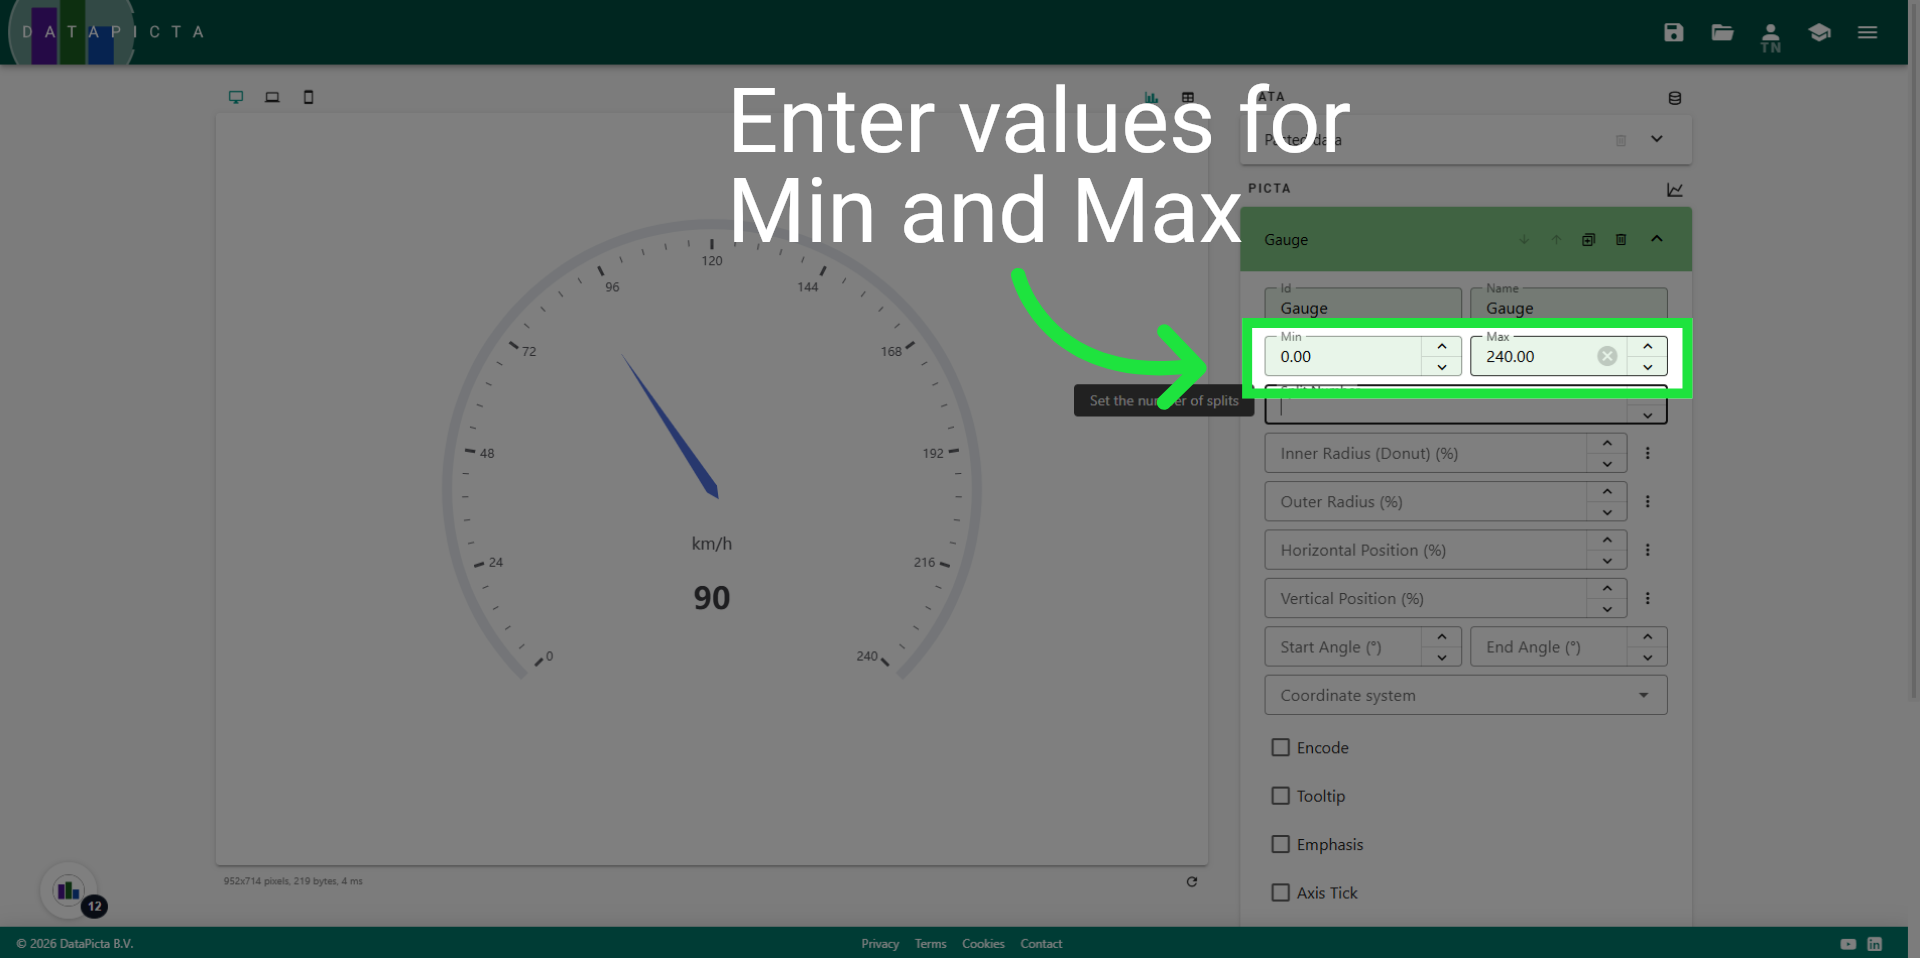
9. Select Number of Splits
Enter 0 for the minimal value and 240 for the maximum value.
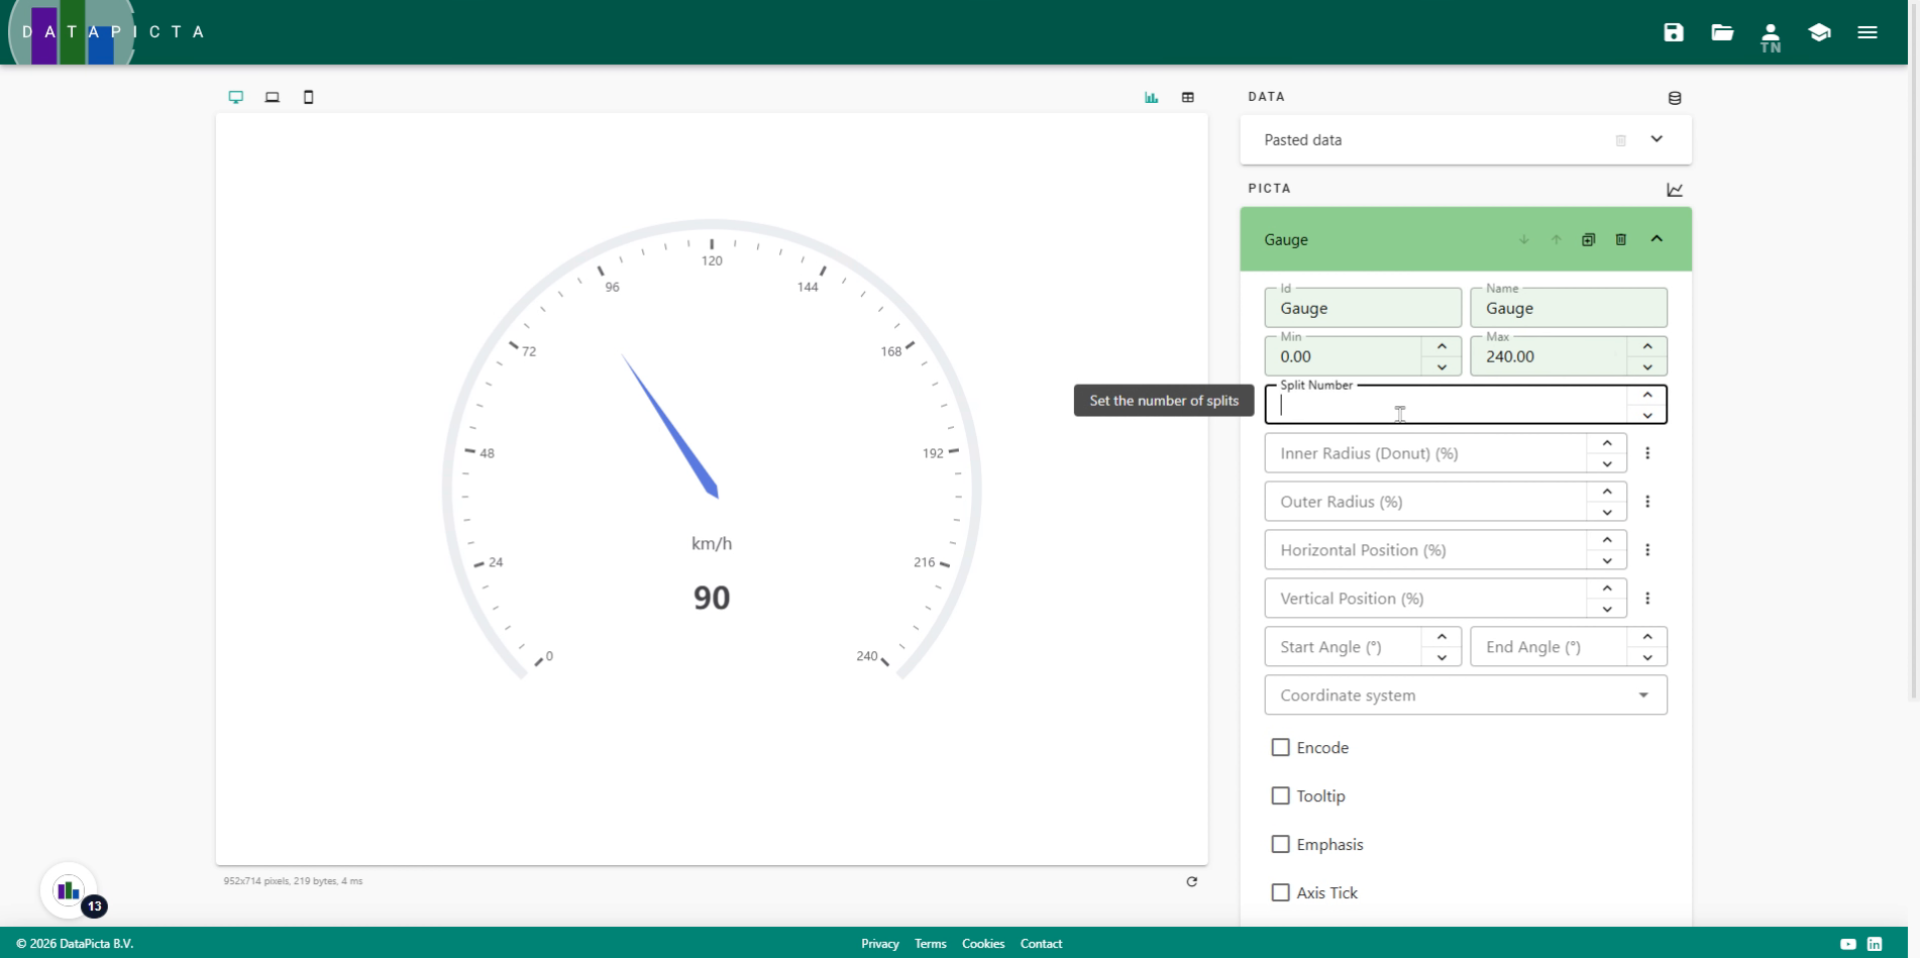
10. Enter Split Count
240 can be divided by 12, so let's choose 12 as the split count; this is the option most car manufacturers prefer.
11. Open Chart Type Menu
We now have a scale of 240 units, divided into steps of 20.
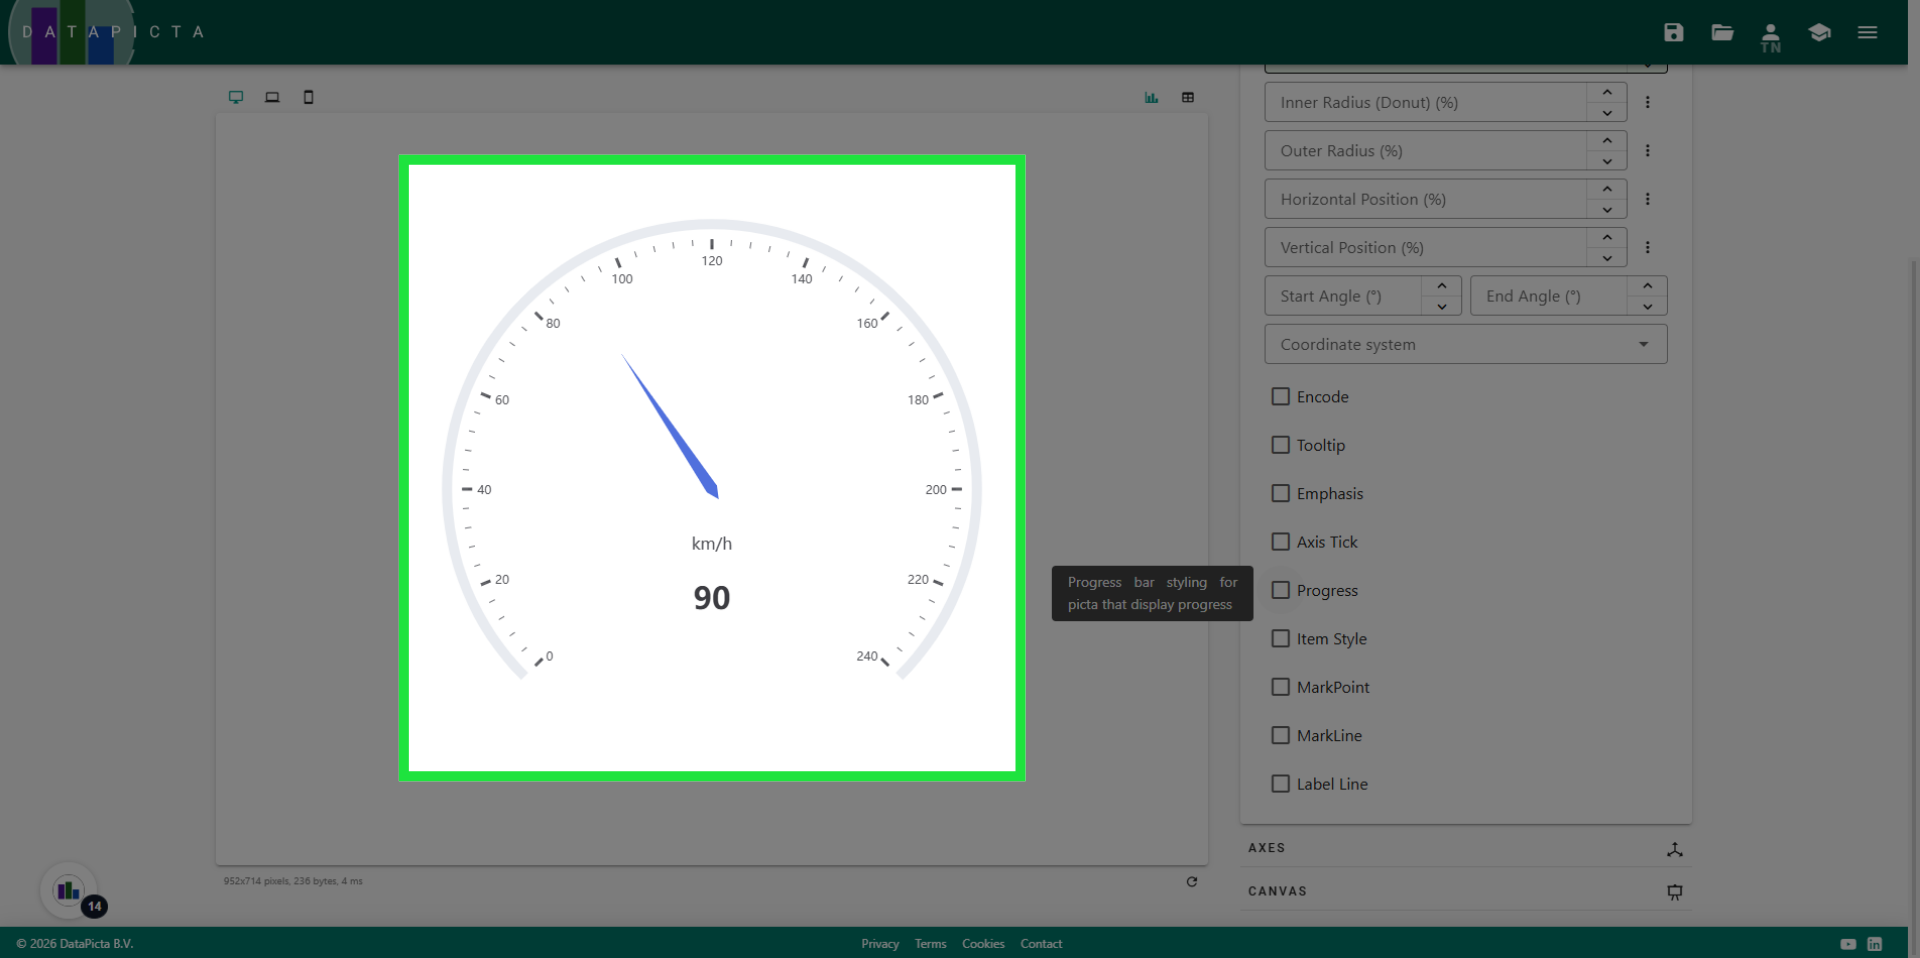
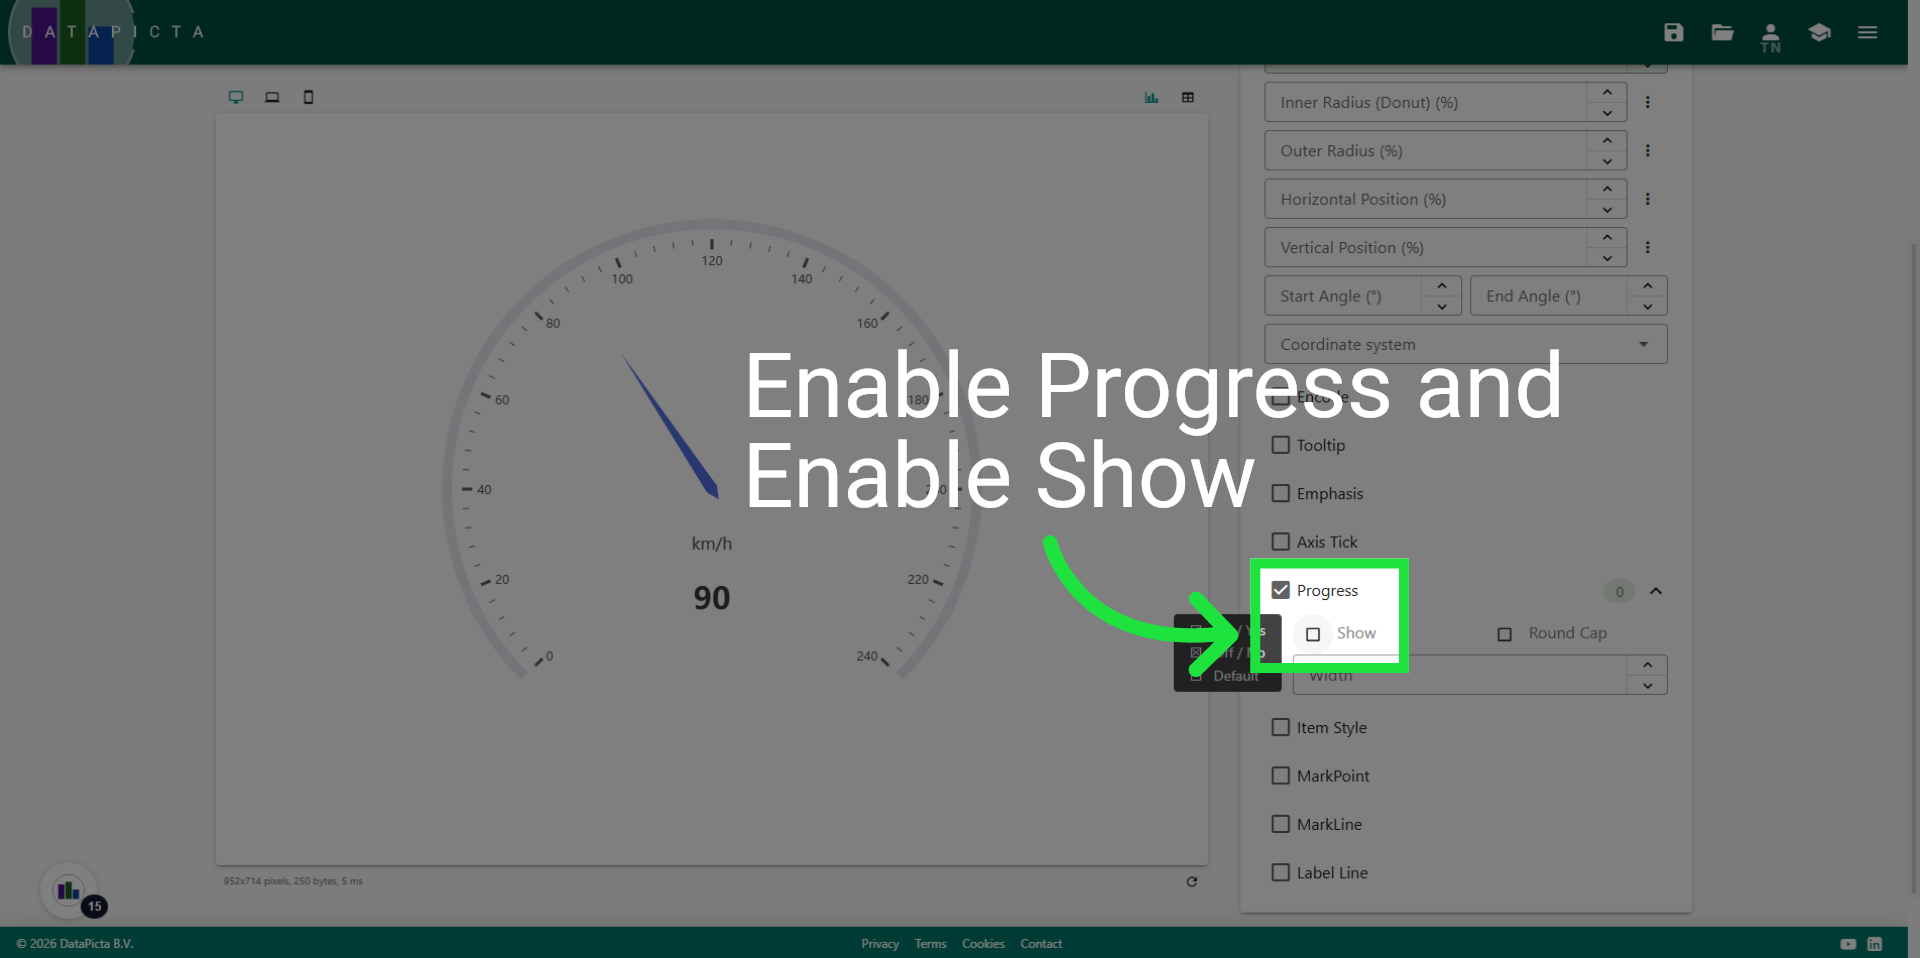
12. Choose Chart Style
As a finishing touch we will add a progress indicator to the odometer. Enable progress and then click show.
13. Done
A line is added to the odometer to indicate the vehicle's speed.