Home
Pricing
Docs
Overview
Data
Pictas
Axes
Canvas
Save & Publish
Subscriptions
STORIES
Latest
11
TUTORIALS
Beginner
9
Intermediate
8
Advanced
2
EXAMPLES
Line
18
Bar
26
Pie
8
Scatter
4
Geo
2
Candlestick
2
Radar
1
Heatmap
2
Tree
6
Treemap
5
Sunburst
5
Sankey
4
Funnel
1
Gauge
3
Streamgraph
1
Combined Charts
5
Bar
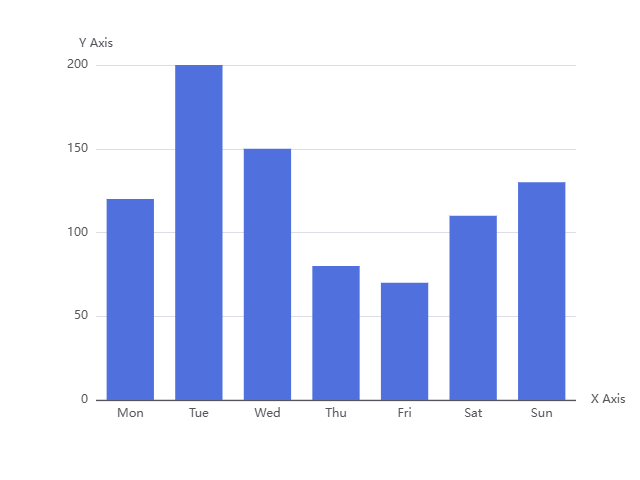
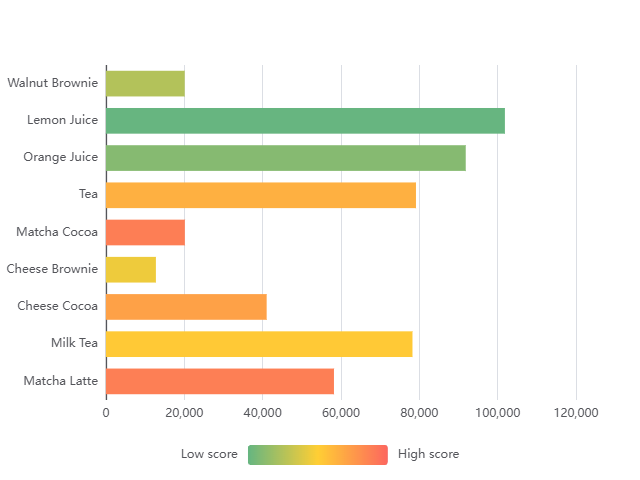
Basic Bar
Axis Align with Tick
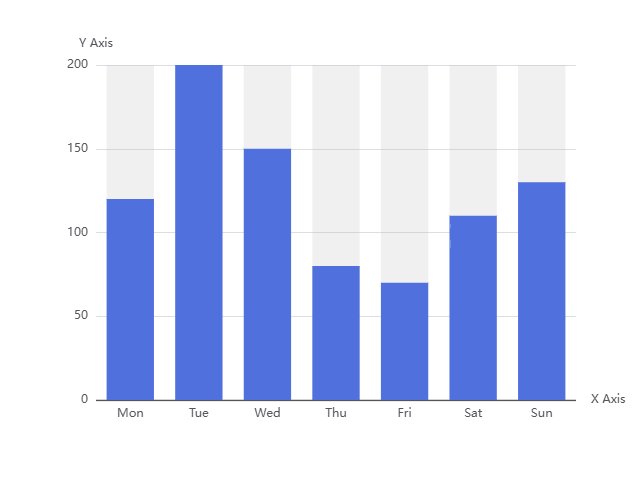
Bar with Background
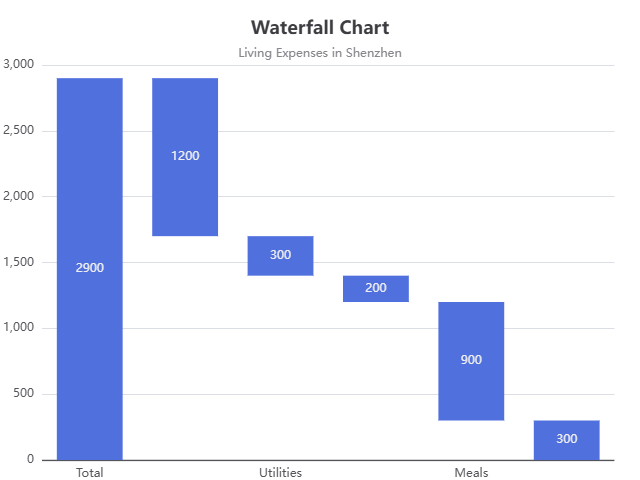
Waterfall Chart
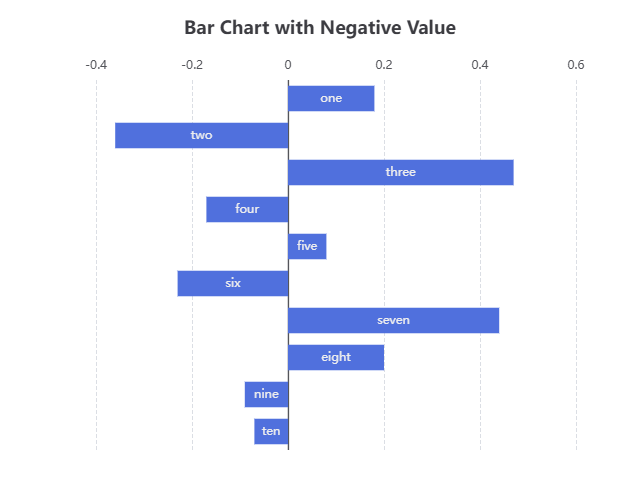
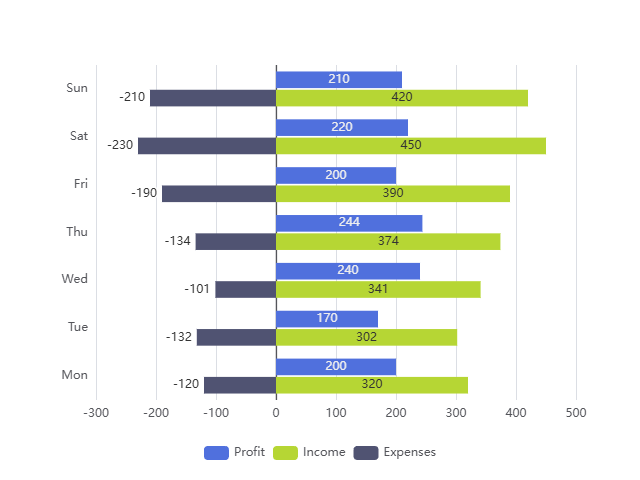
Bar Chart with Negative Value
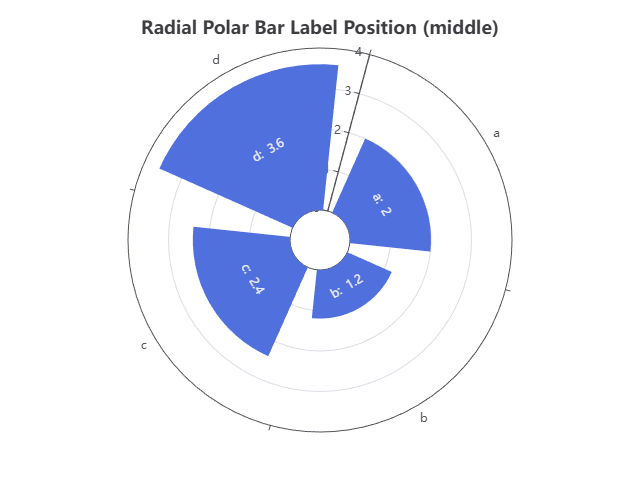
Radial Polar Bar Label Position
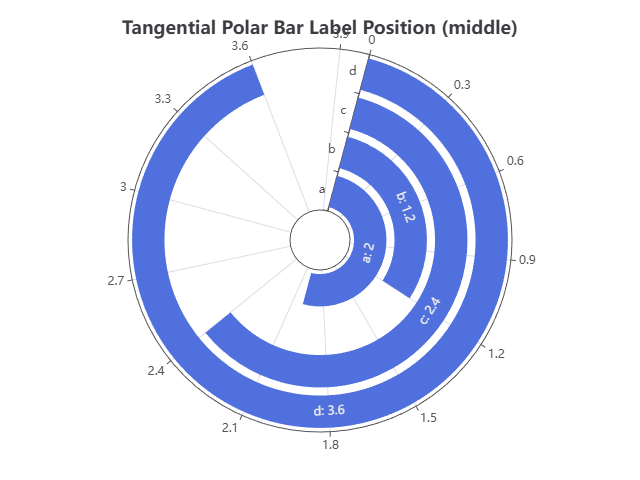
Tangential Polar Bar Label Position middle
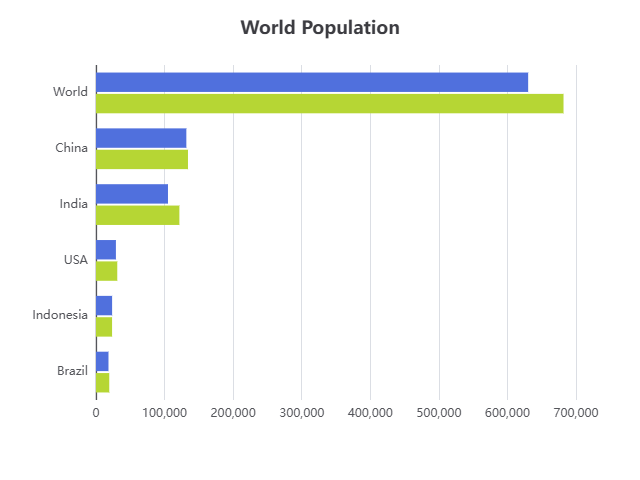
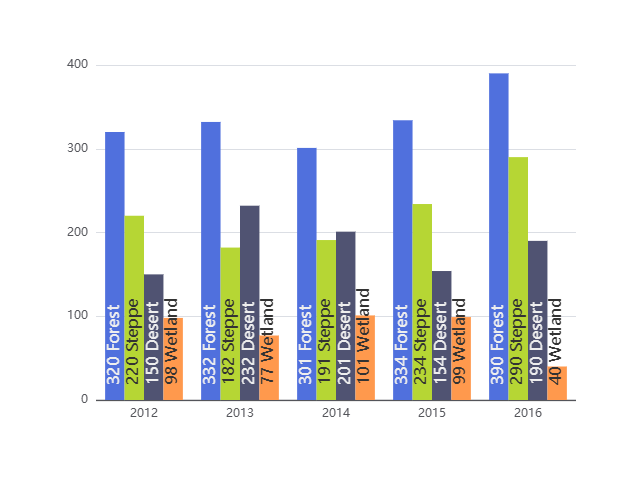
World Population
Polar endAngle
Bar Label Rotation
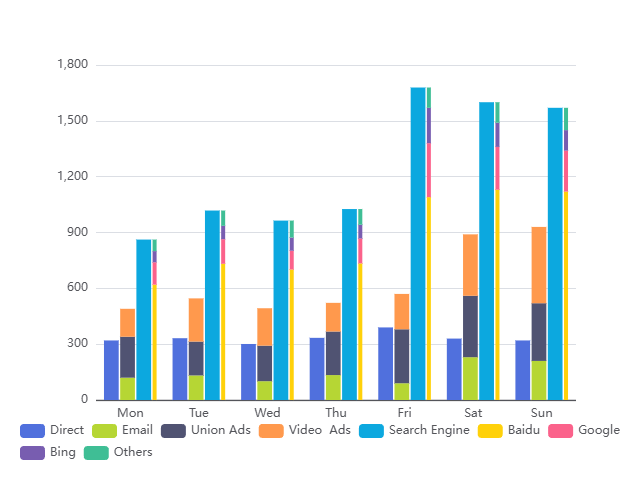
Stacked Column Chart
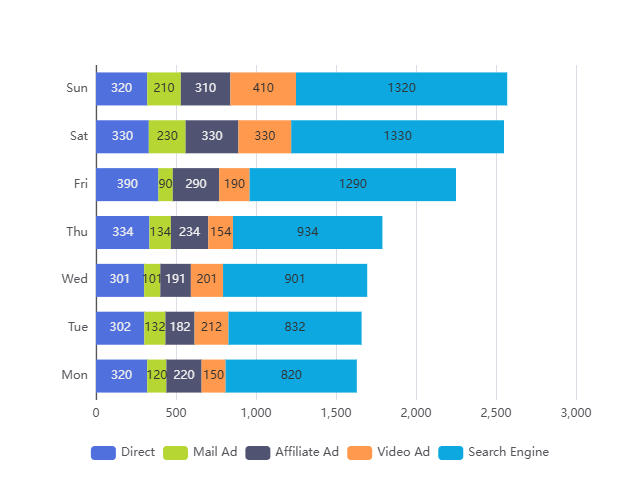
Stacked Horizontal Bar
Bar Chart with Negative Value
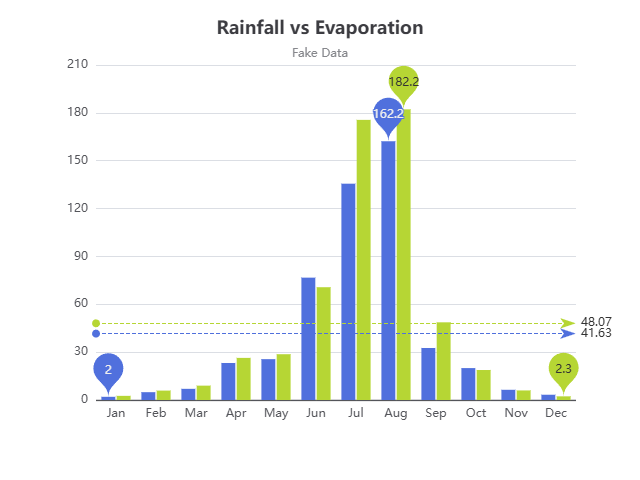
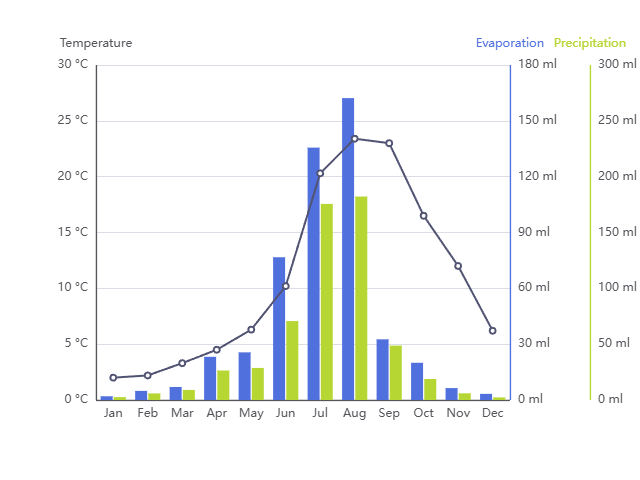
Rainfall and Evaporation
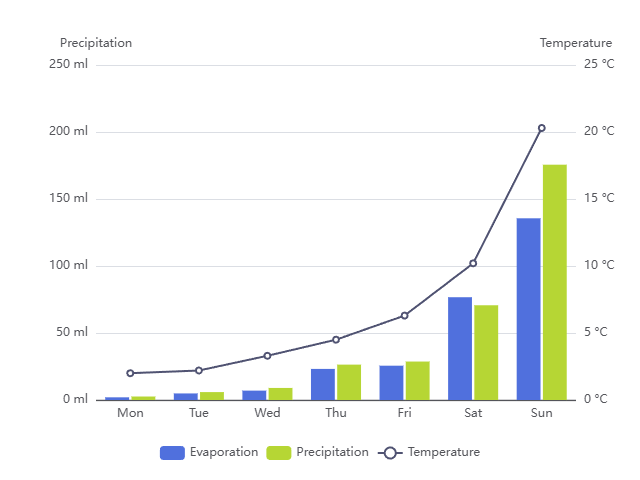
Mixed Line and Bar
Mix and Zoom
Multiple Y Axes
Animation
Datazoom
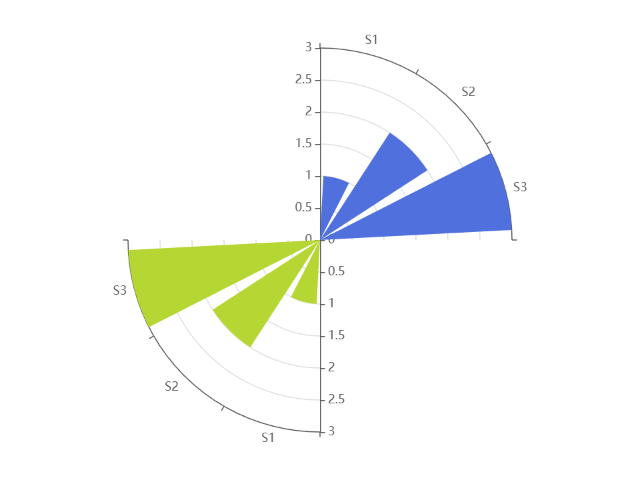
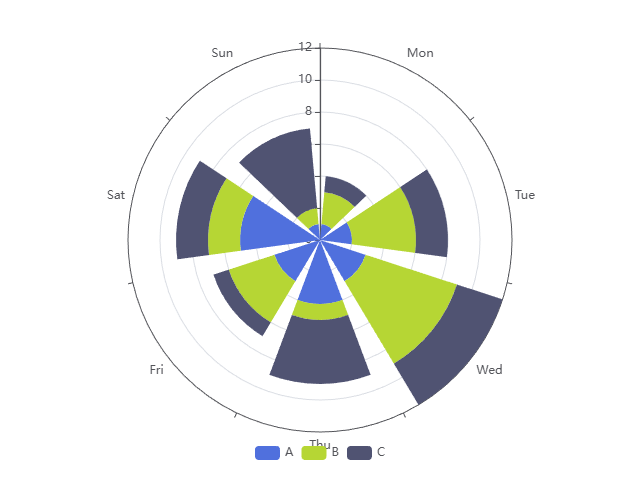
Stacked Bar Chart on Polar
Stacked Bar Chart on Polar -Radial-
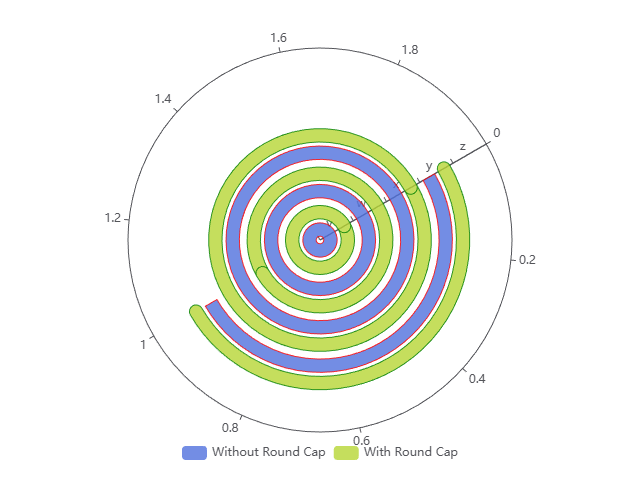
Rounded Bar on Polar
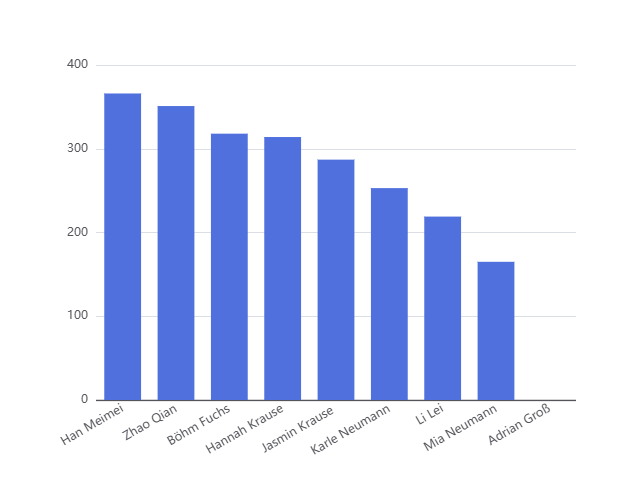
Sort Data in Bar Chart
Simple Data Binding
Layout By Column and Row
Simple Example of Dataset
About
About us
Contact us
Roadmap
Affiliate Program
Compare
Compare all tools
Datawrapper alternatives
Flourish alternatives
Infogram alternatives
Visme alternatives
RAWGraphs alternatives
Legal
Privacy Policy
Terms of Service
Third-Party Licenses