A Simple Bar Chart
Learn how to create a simple bar chart using DataPicta.
This tutorial guides you through creating a data visualization using sample data in DataPicta.
Go to app.datapicta.com to open the DataPicta application.
1. Introduction
You will learn how to load sample data, search for specific entries, and customize your chart type.
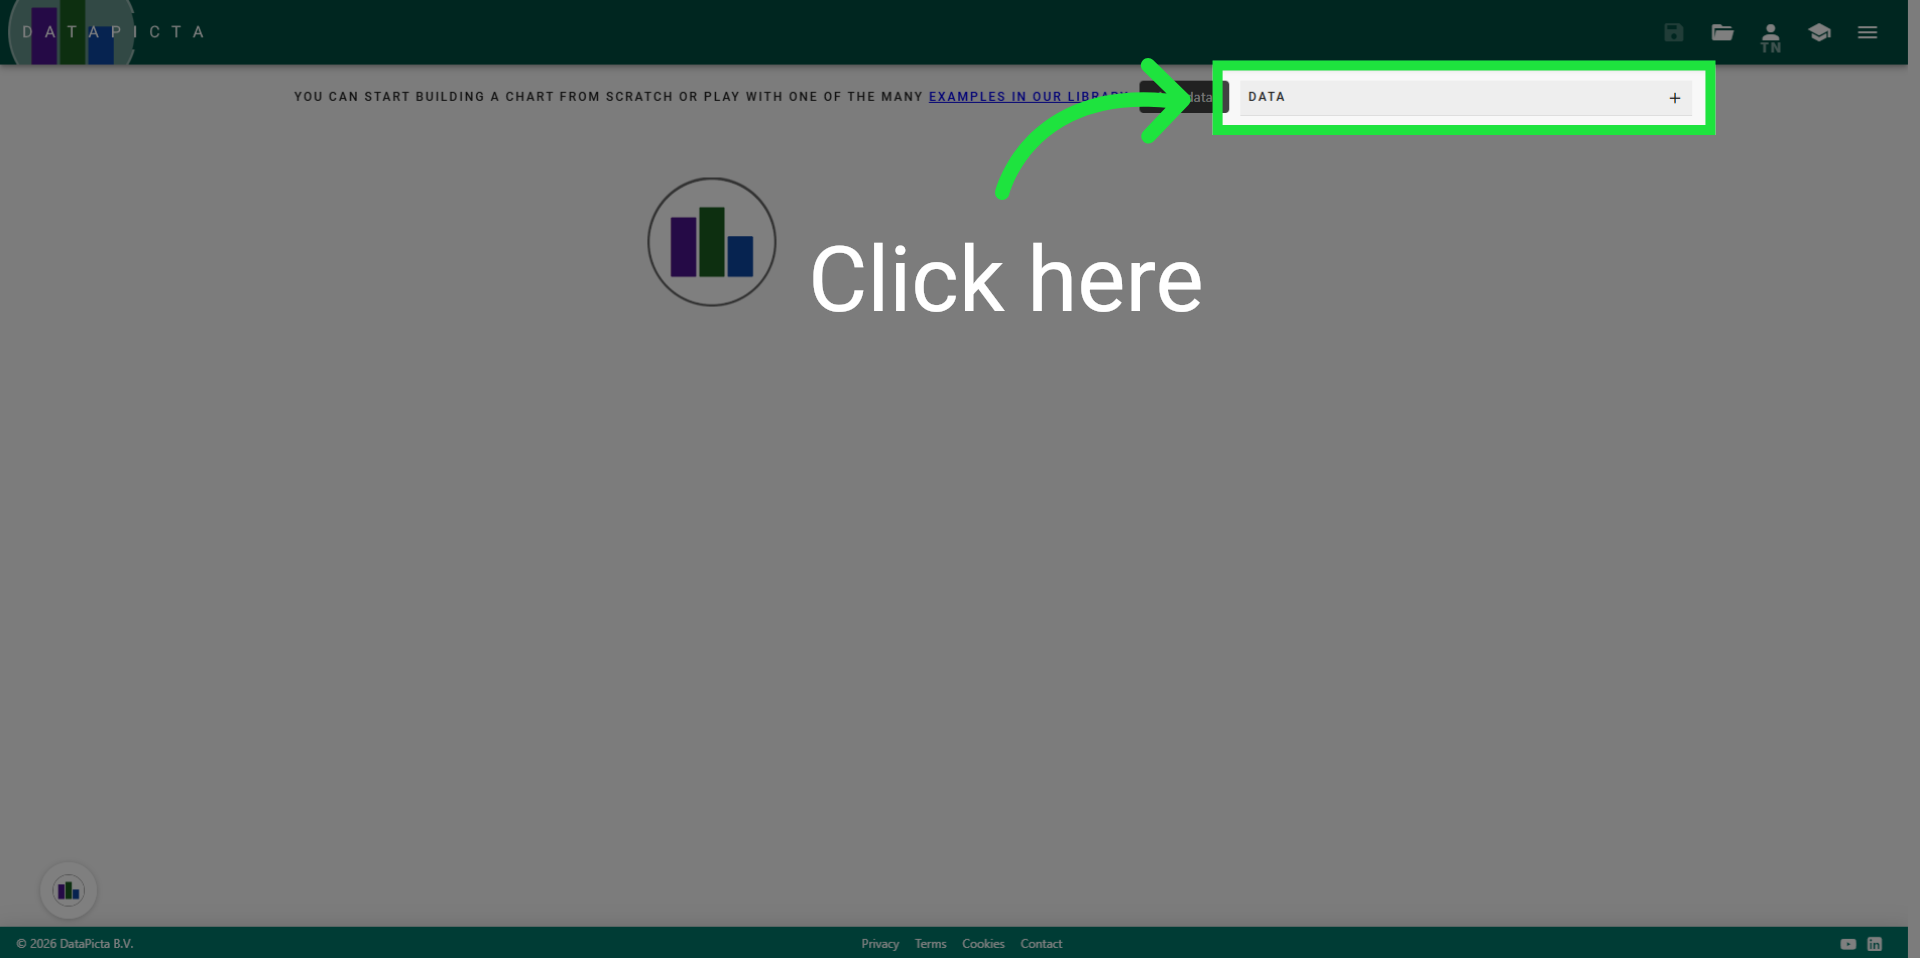
2. Open the Add Data Dialog
The first thing to do is loading some data, you can open the 'Add Data' dialog by clicking 'Data'.
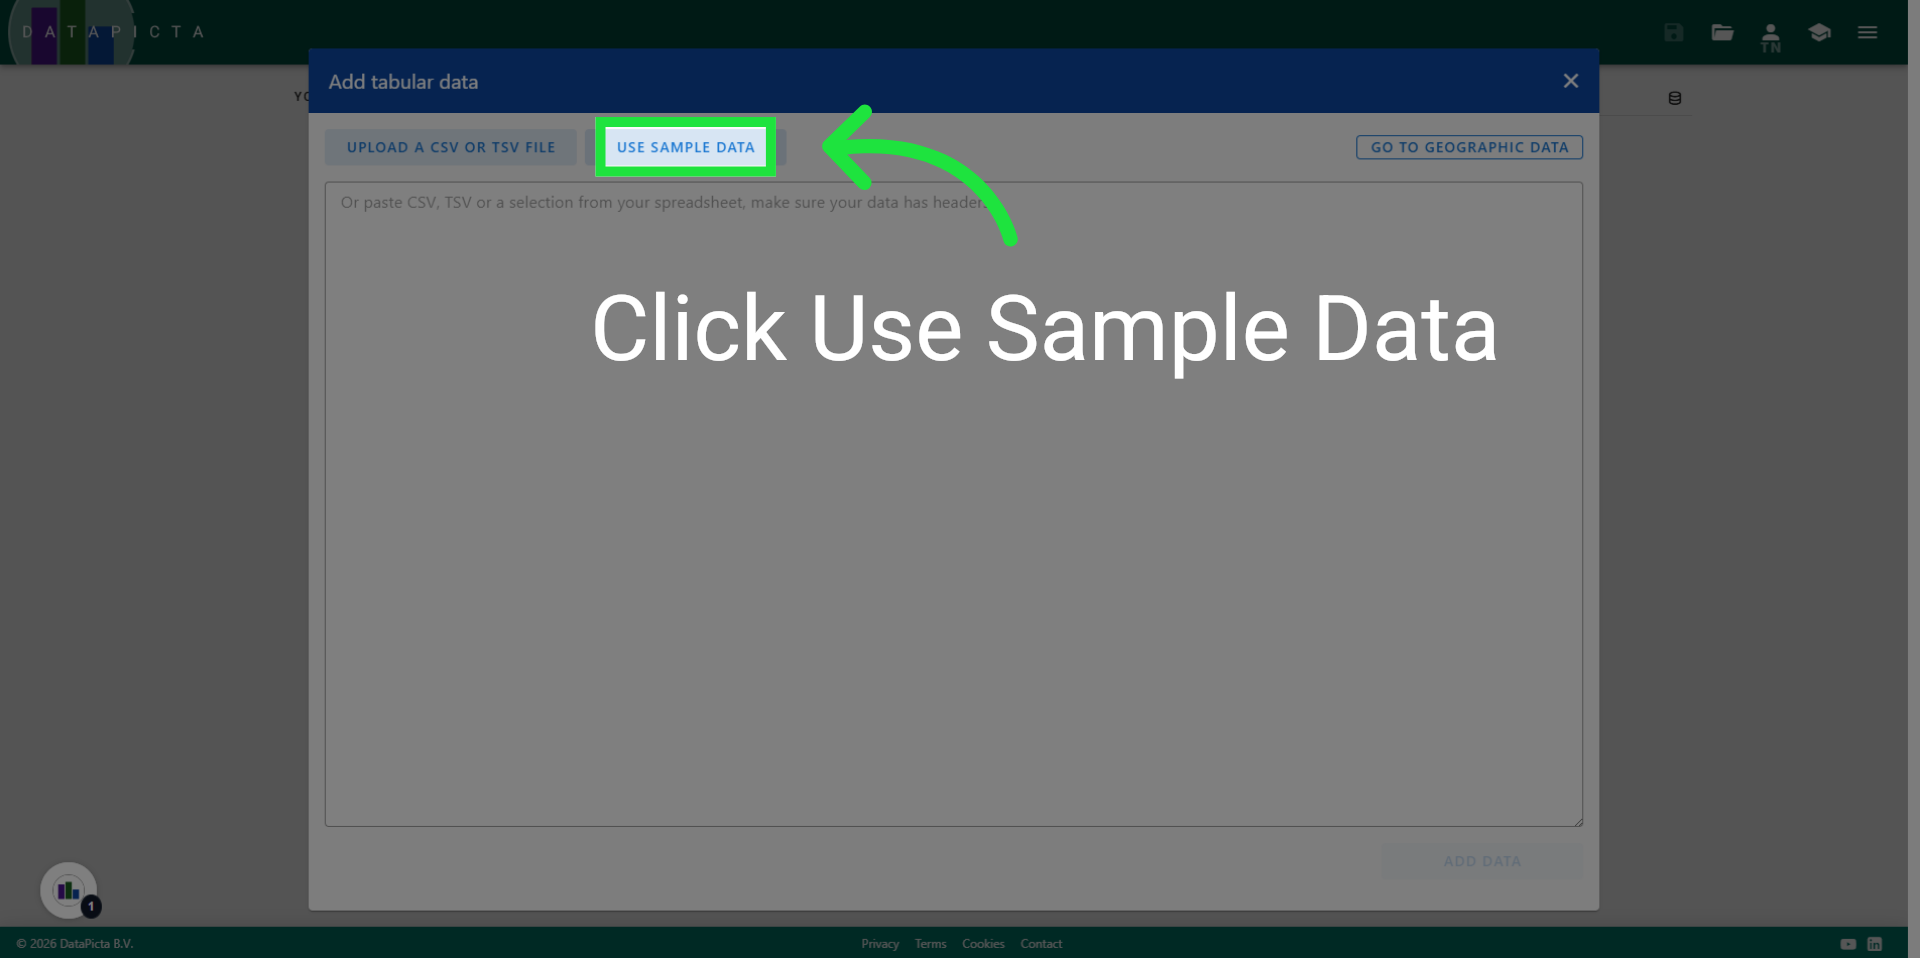
3. Use Sample Data
For this tutorial we use one of the many sample datasets in DataPicta. Click 'Use Sample Data'.
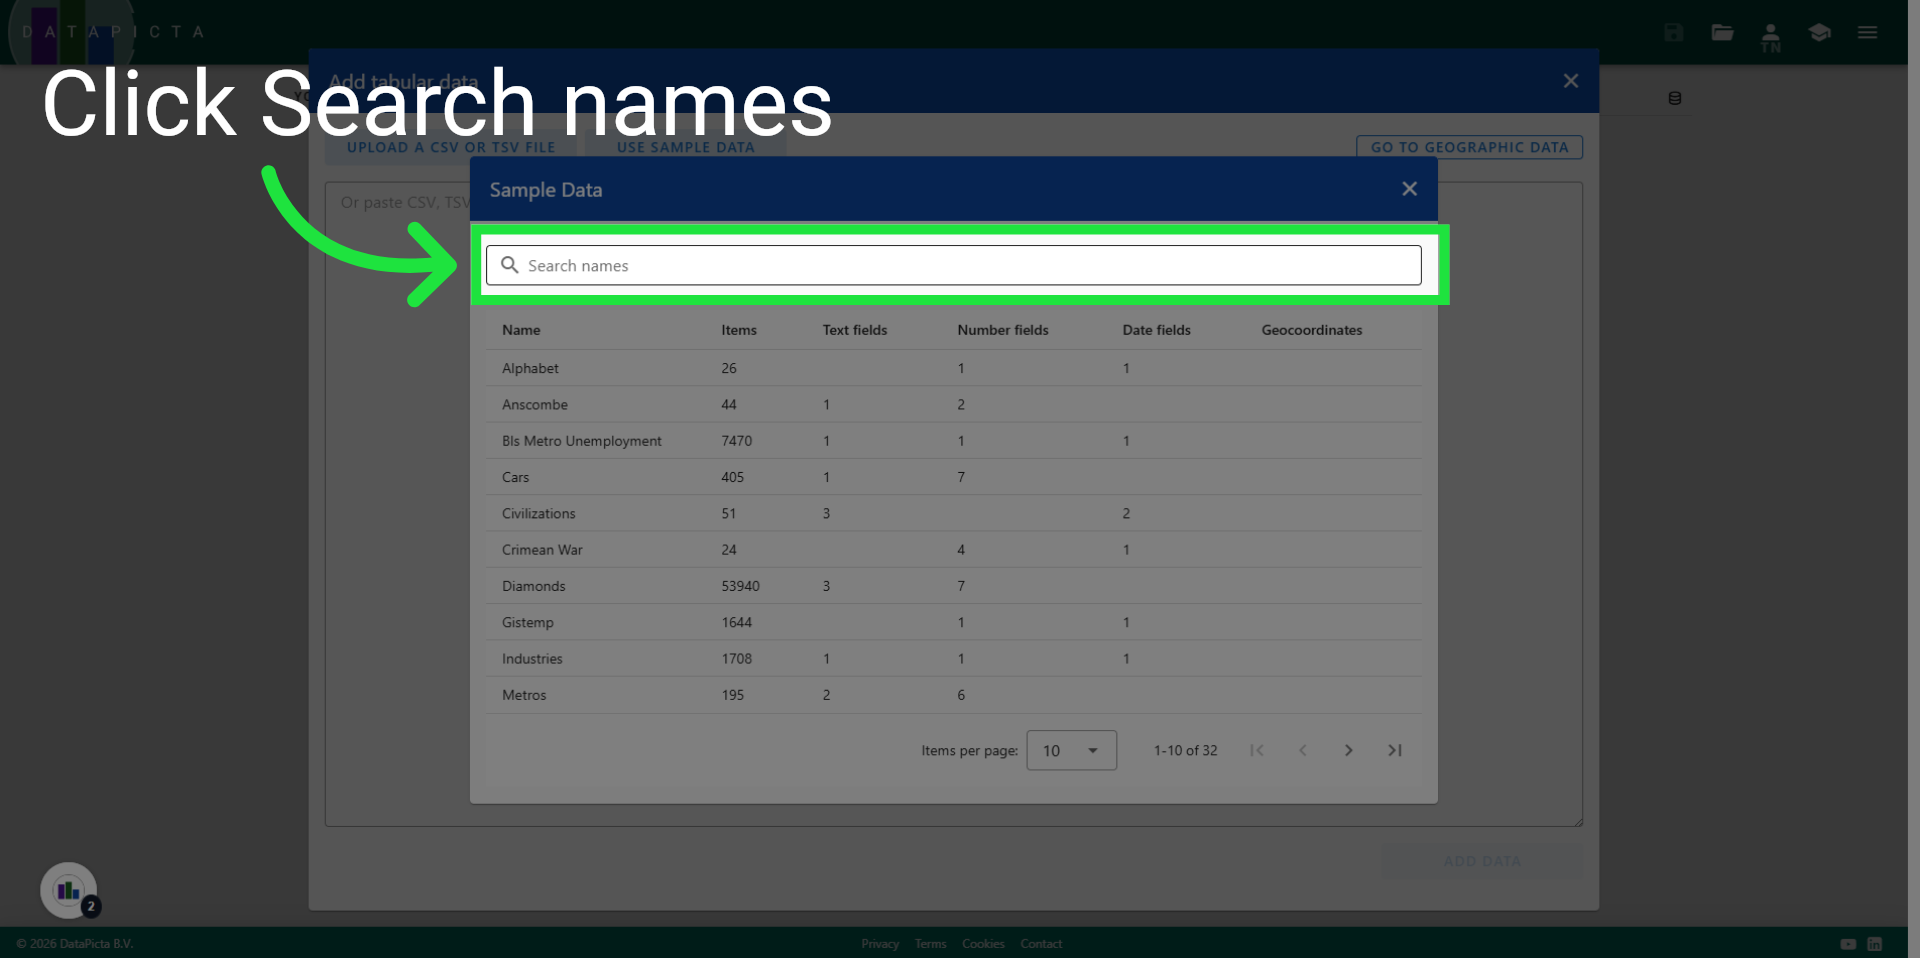
4. Search Dataset
Click the search box and search for the "Product Sales" dataset.
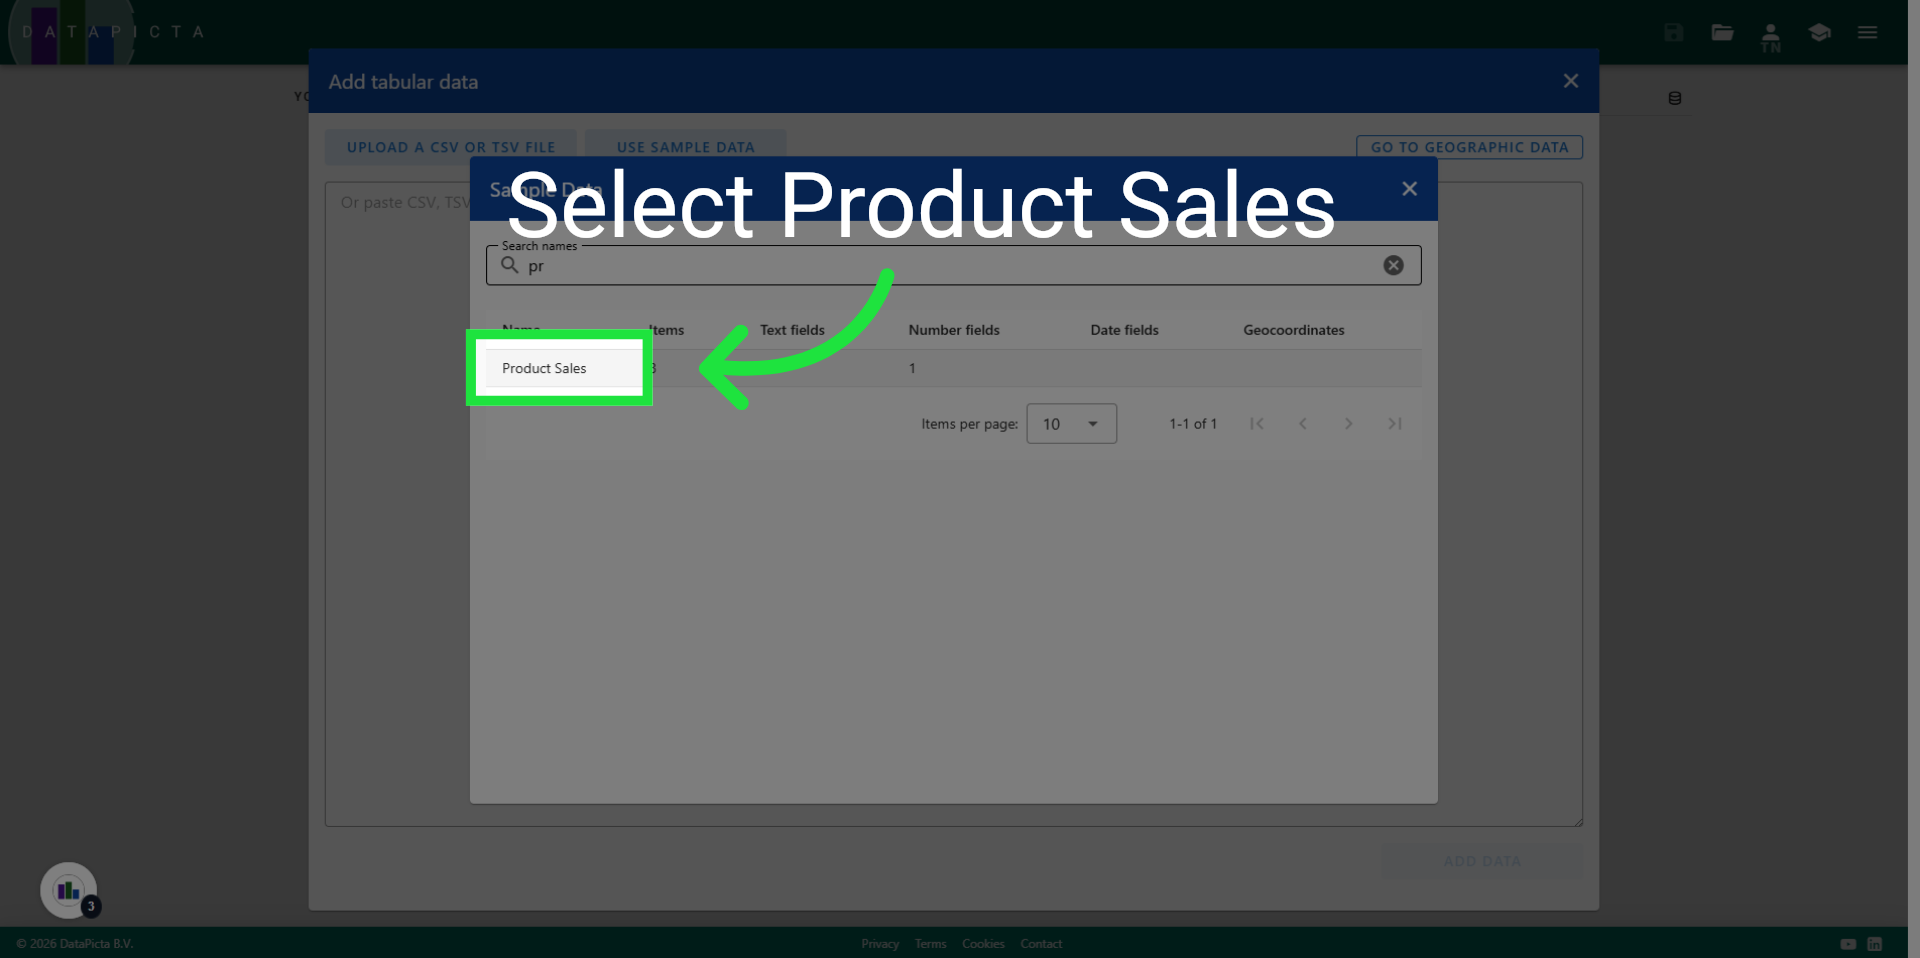
5. Select Product Sales Data
Click "Product Sales" to load this data.
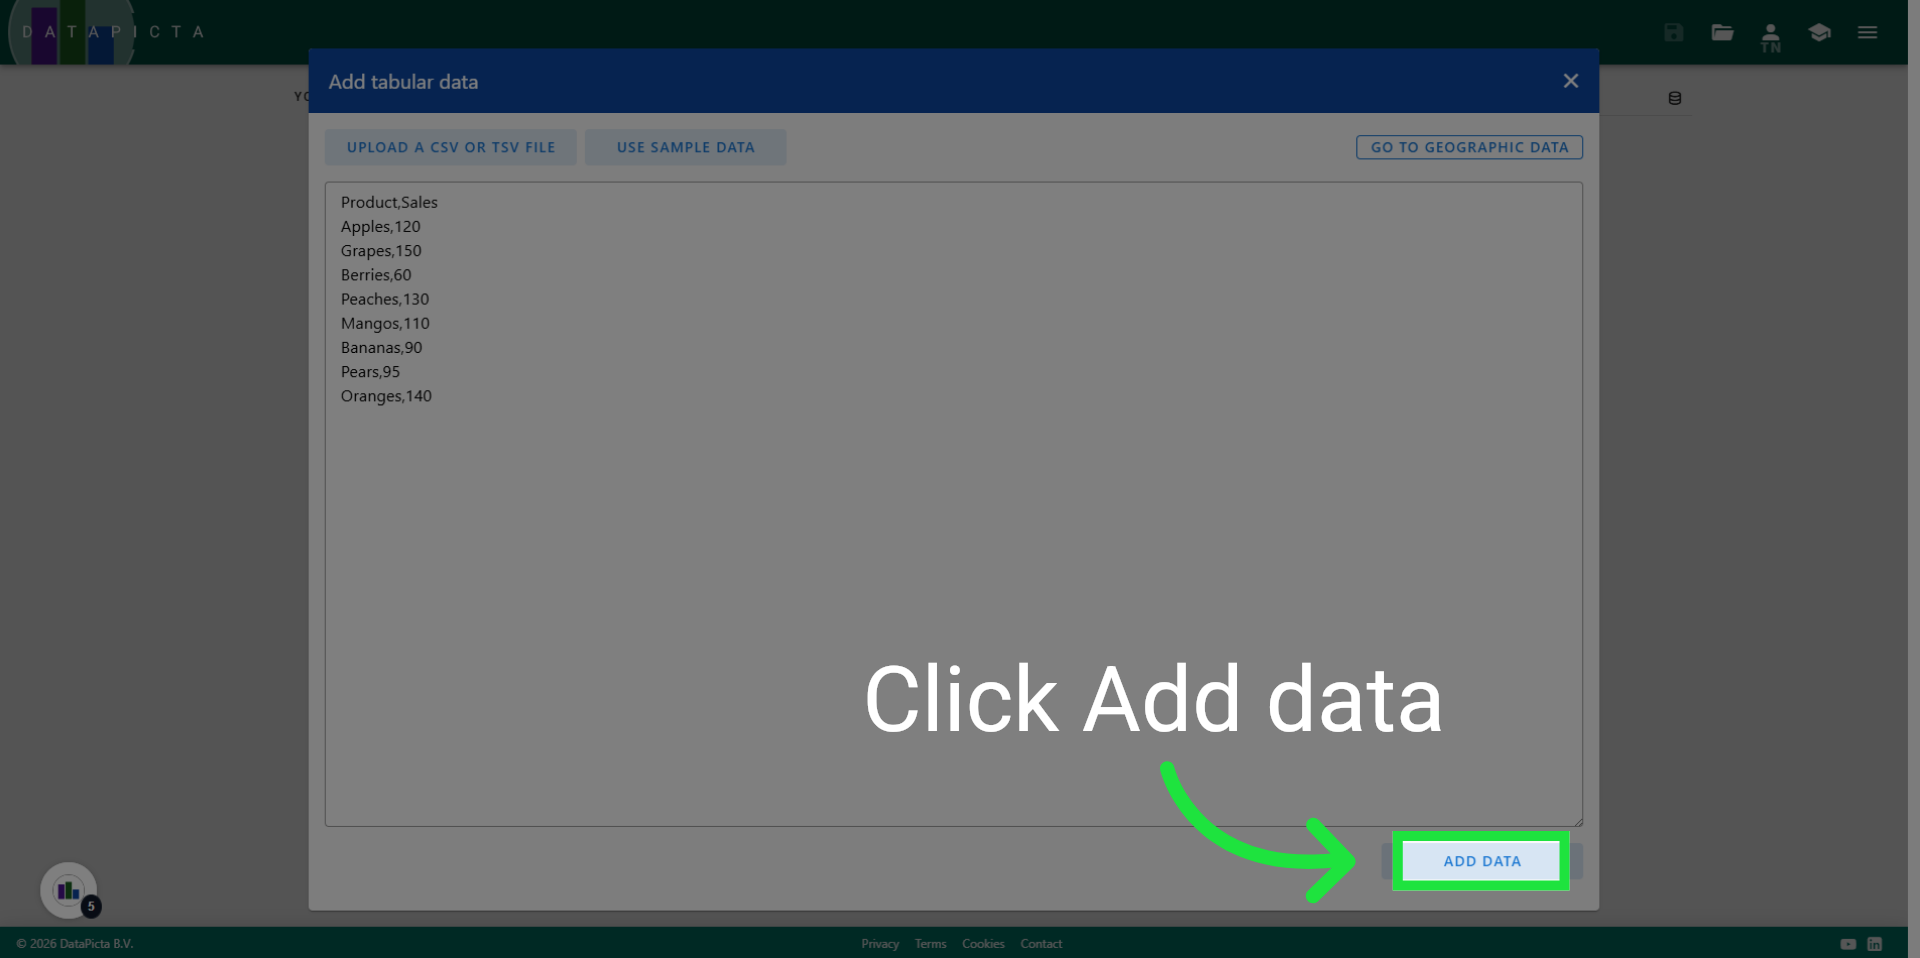
6. Add Data to Visualization
Click "Add data" to include this data in your chart.
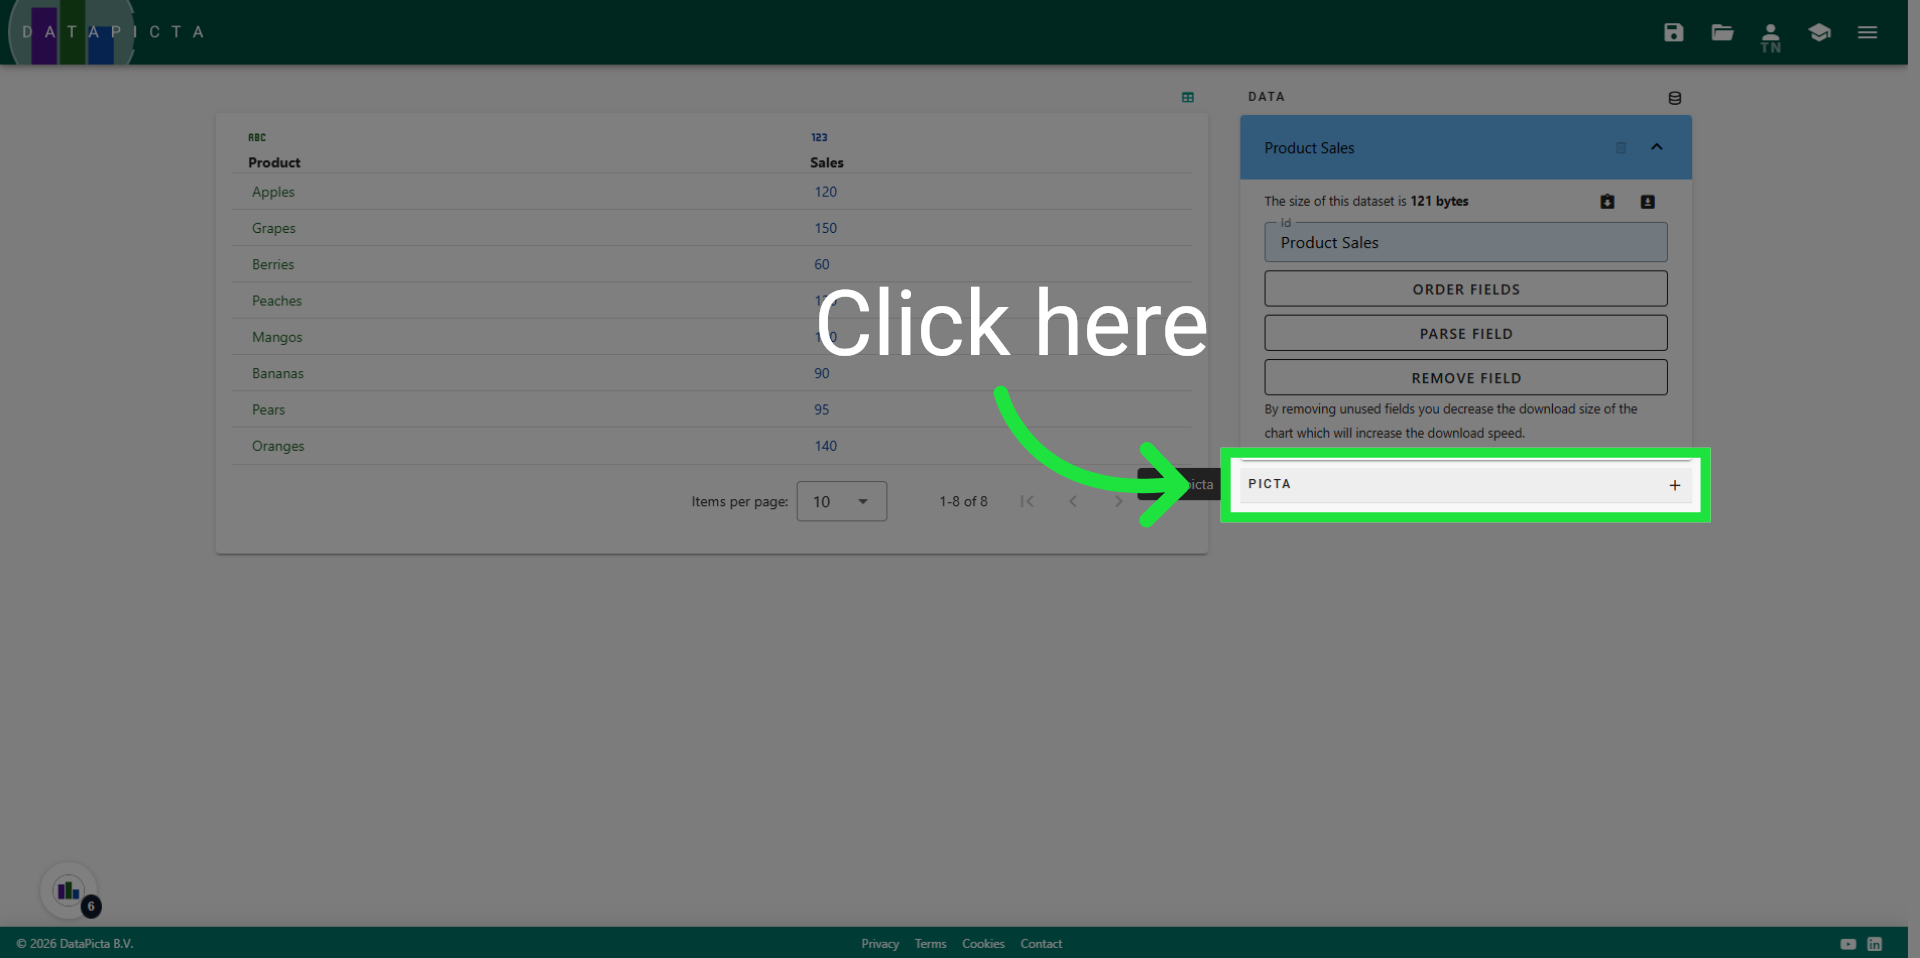
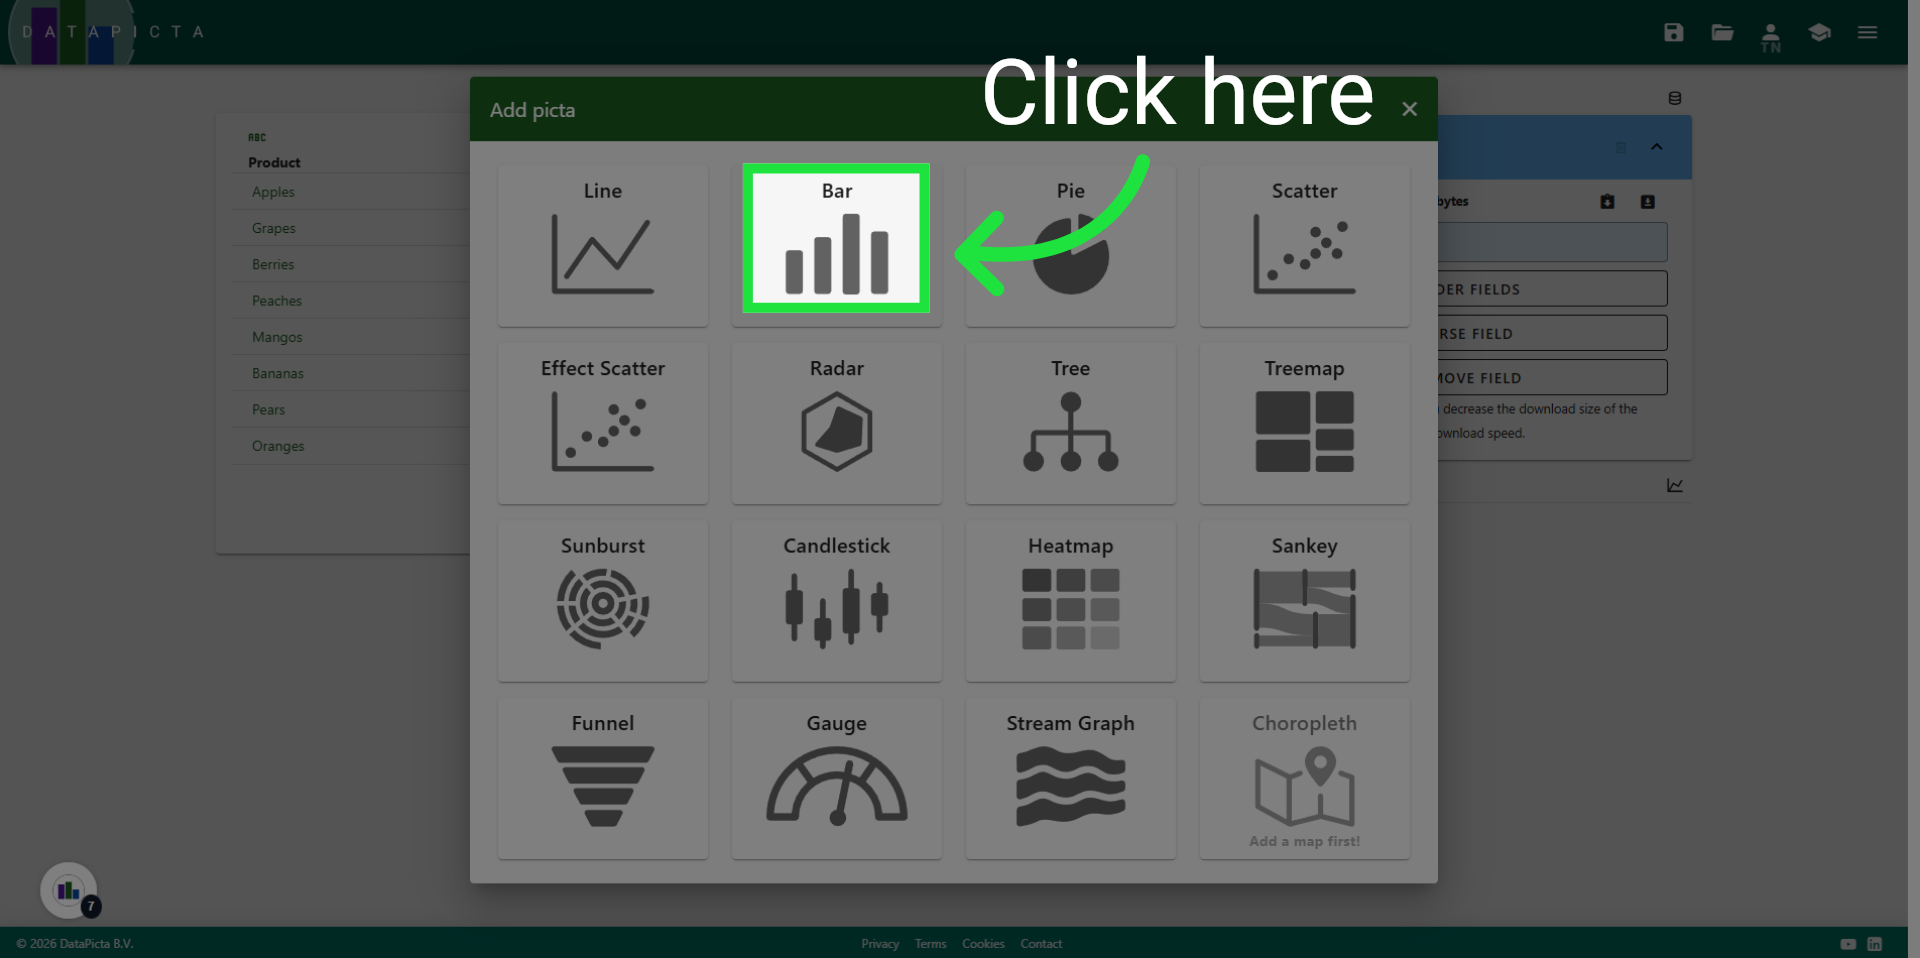
7. Open the Picta Dialog
Open the "Add Picta" dialog to add a Picta to your chart.
8. Choose Bar Picta
Click "Bar" to add the bar picta to your chart.
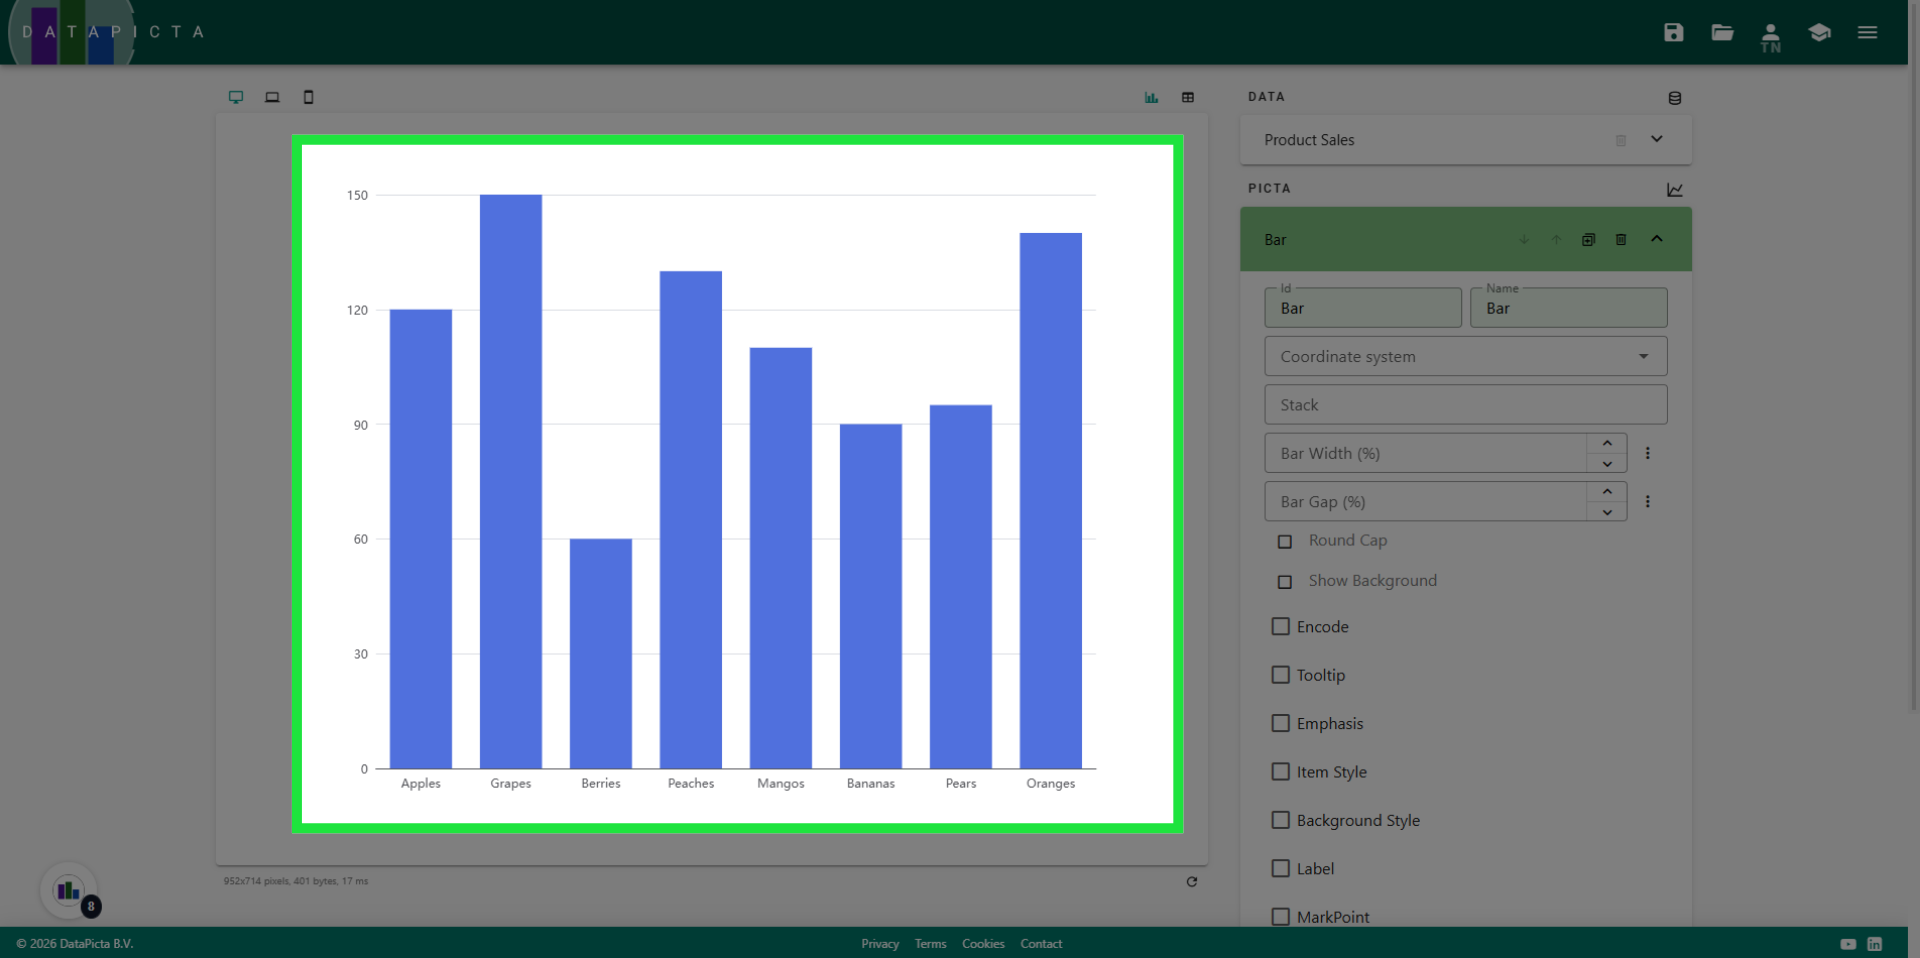
9. Done
And that's it, you created a simple bar chart. You can now save, publish and share your creation.